
Image
|
Figure Caption
Fig. 1
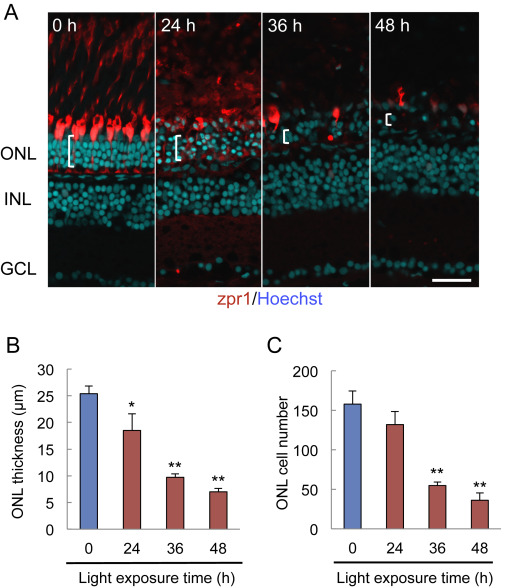
Retinal degeneration induced by light irradiation shows time dependency. (A) Typical images immunostained for zpr1 (red) and Hoechst 33342 (blue). (B-C) Quantification of ONL thickness and ONL cell number using immunostaining. Data are shown as means ± SEM (n = 5-8). **p < 0.01 and *p < 0.05 vs. 0 h (Student′s t-test). Scale bar = 30 µm. GCL, ganglion cell layer; INL, inner nuclear layer; ONL, outer nuclear layer; OS, outer segment.
Figure Data
Acknowledgments
This image is the copyrighted work of the attributed author or publisher, and
ZFIN has permission only to display this image to its users.
Additional permissions should be obtained from the applicable author or publisher of the image.
Full text @ J. Pharmacol. Sci.