
Image
|
Figure Caption
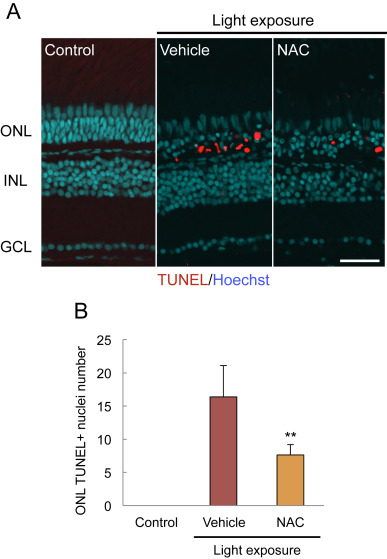
Fig. 3
Intravitreal administration of NAC diminishes light-induced increases in TUNEL-positive ONL cells. (A) Typical images showing TUNEL-positive (red) and DNA (Hoechst 33342, blue) stained cells. (B) Quantification of the TUNEL-positive nuclei number. Data are shown as means ± SEM (n = 7 or 8). *p < 0.05 vs. vehicle (Student′s t-test). Scale bar = 30 µm. GCL, ganglion cell layer; INL, inner nuclear layer; NAC, N-acetylcysteine; ONL, outer nuclear layer.
Figure Data
Acknowledgments
This image is the copyrighted work of the attributed author or publisher, and
ZFIN has permission only to display this image to its users.
Additional permissions should be obtained from the applicable author or publisher of the image.
Full text @ J. Pharmacol. Sci.