
- Title
-
Leptospiral outer membrane protein LipL32 induces inflammation and kidney injury in zebrafish larvae
- Authors
- Chang, M.Y., Cheng, Y.C., Hsu, S.H., Ma, T.L., Chou, L.F., Hsu, H.H., Tian, Y.C., Chen, Y.C., Sun, Y.J., Hung, C.C., Pan, R.L., Yang, C.W.
- Source
- Full text @ Sci. Rep.
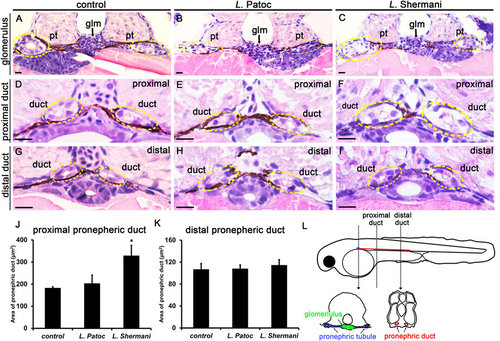
Leptospira Shermani induced acute tubular injury in zebrafish larvae. Transverse histological sections (H&E stain) from control (A,D,G), L. Patoc-treated (B,E,H), and L. Shermani-treated larvae (C,F,I). Note the marked swelling of the proximal pronephric ducts (circles) in L. Shermani-treated larvae compared with L. Patoc-treated larvae and controls. The differences were not evident in the distal pronephric ducts. Living larvae were incubated in E3 media containing L. Shermani or L. Patoc (1 × 10⁶ CFU/ml) from 24 hpf to 48 hpf. Control larvae were incubated with E3 buffer only. Representative micrographs from the level of the glomerulus (A-C), proximal pronephric duct (D-F), and distal pronephric duct (G-I) are shown. Circles indicate the location of the pronephric duct. Pt, pronephric tubule; Glm, glomerulus; Scale bar, 10 µm. (J,K) Quantification of the area of pronephric ducts. *P < 0.05 compared to control. n = 6 from three larvae in each group. (L) Diagram of transverse sections illustrating the structure of zebrafish pronephros at 48 hpf. PHENOTYPE:
|
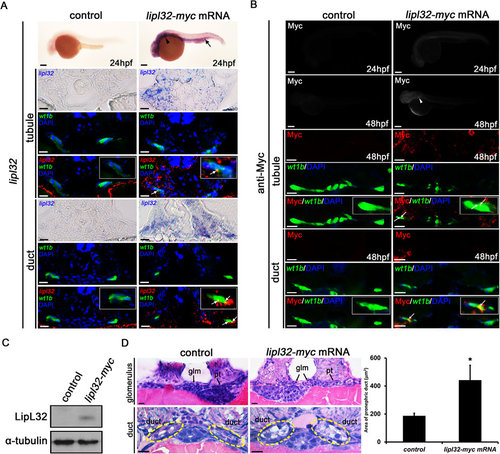
Microinjection of myc-tagged lipl32 mRNA and ectopic expression of LipL32 in zebrafish larvae. (A) Whole-mount in situ hybridization for lipl32 mRNA (lateral view, head to the left, scale bar, 200 µm). The expression of lipl32 mRNA was prominent in the head, the pronephric region (arrowhead) and the posterior blood island (arrow) in the transgenic wt1b:GFP line at 24 hpf. In transverse sections, signals detected by in situ hybridization are pseudocolored in red and merged to GFP immunostaining (green) to locate the pronephros. The white arrows indicate colocalization (orange stain) of lipl32 and GFP signals. Nuclei are stained with DAPI (blue). Scale bar, 20 µm. (B) Whole-mount immunostaining for Myc tag at 24 and 48 hpf. The expression of Myc tag was detected in the pronephric region (arrowhead) in lipl32 mRNA-injected larvae (scale bar, 200 µm). In transverse sections, the white arrow indicates colocalization (orange stain) of Myc tag (red) and wt1b:GFP fluorescence (green) in pronephric tubules and ducts. Scale bar, 10 µm. (C) Cropped western blot shows the expression of LipL32 protein in lipl32 mRNA-injected larvae at 48 hpf but not in control larvae under the same experimental condition. Whole larva lysates were immunoblotted with a customized antibody against LipL32. The uncropped blot is shown in Supplementary Figure S1. (D) Transverse sections (H&E stain, scale bar, 10 µm) show non-fusion of the glomerulus and markedly swelling of the pronephric ducts in lipl32 mRNA-injected larvae. Quantification of the area of proximal pronephric ducts is shown (*P < 0.05 compared to control). Pt, pronephric tubule; Glm, glomerulus. Circles indicate the location of the pronephric duct. Control larvae were injected with pCS2 (A,B) or myc mRNA (C,D). |
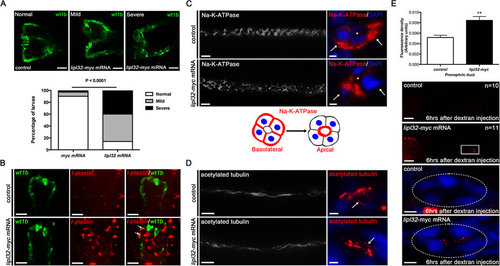
LipL32 induced pronephric malformation, inflammatory cell infiltration and translocation of NA-K-ATPase in zebrafish tubular epithelial cells. (A) Quantification of normal, mild or severe deformities of pronephros between groups of wt1b:GFP larvae at 48 hpf (n = 30 to 35 in each group). Photos were collected by in vivo observation under fluorescence microscopy (dorsal view, anterior to the left). Pronephric kidneys show abnormalities in glomerular fusion, cystic changes, and deformities of pronephric tubules and ducts. Scale bar, 50 µm. (B) In situ hybridization shows that l-plastin positive cells (pseudo-colored by red) were increased in lipl32 mRNA-injected larvae compared to control. Arrows indicate a colocalization (orange) of GFP staining (green) and l-plastin in the pronephric tubule and duct. Scale bar, 50 µm. (C) Immunostaining for NA-K-ATPase shows the normal basolateral location of NA-K-ATPase in the pronephric ducts was disorganized in lipl32 mRNA injected larvae (scale bar, 10 µm). Arrows indicate the basolateral cell surface. Right panels are transverse sections on whole-mount stained larvae on the left (scale bar, 2 µm). A diagram illustrating the changes in the cellular location of NA-K-ATPase is shown. (D) Immunostaining for acetyl-tubulin shows no significant differences of pronephric cilia (arrows) between groups (scale bar, left panel, 10 µm, right panel, 2 µm). (E) The retention rates of 10-kDa rhodamine dextran as measured from the boxed region of the posterior pronephric ducts 6 hours after pericardial injection were significantly reduced in the lipl32 mRNA-injected larvae compared to myc-mRNA controls (**P < 0.01, n = 10 to 11 in each group, scale bar, 100 µm). Transverse sections demonstrate retention of rhodamine fluorescence in the lumen of pronephric ducts (circle) in lipl32 mRNA-injected larvae (scale bar, 5 µm). |
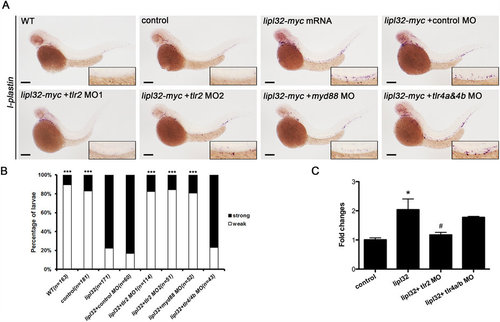
LipL32 promoted pronephric inflammation through the TL2R pathway in zebrafish. Morpholino (MO) knockdown of tlr2 but not tlr4a and tlr4b attenuated the expression of l-plastin induced by microinjection of myc-tagged lipl32 mRNA. (A) In situ hybridization for l-plastin in zebrafish larvae at 48 hpf, with MO-knockdown of tlr2, myd88 and tlr4a/4b in response to lipl32-myc mRNA injection. Wild-type (WT) larvae and myc mRNA-injected control larvae are shown. All panels are lateral view (head toward the left). The insets are enlarged views of the corresponding boxed regions containing the pronephric ducts. (B) Comparative frequencies of strong and weak staining of l-plastin with different MOs (n = 43 to 171 from two experiments, ***P < 0.0001 versus lipl32 mRNA). (C) Quantitative real-time RT-PCR analyses show that tlr2 MO inhibited the expression of l-plastin induced by LipL32. Results shown are the mean ± SEM from three independent experiments carried out in duplicate (*P < 0.05 versus controls, #P < 0.05 versus LipL32). Scale bar, 200 µm. |
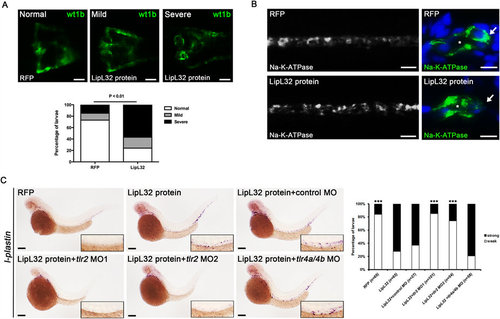
Injection of recombinant LipL32 protein induced pronephric kidney deformity, inflammation, and translocation of NA-K-ATPase. (A) The frequencies of deformities in pronephros were significantly increased in the LipL32-injected group compared to the control group (wt1b:GFP larvae at 48 hpf, n = 21 to 26 in each group, P < 0.01). Purified recombinant LipL32 protein was microinjected into the tail vein of zebrafish larvae at 24 hpf. Control larvae were injected with RFP. Photos were collected by in vivo observation under fluorescence microscopy (dorsal view, anterior to the left). Scale bar, 50 µm. (B) Immunostaining for NA-K-ATPase shows disruption of the basolateral location of NA-K-ATPase in the pronephric ducts in LipL32-injected larvae at 48 hpf. Right panels (scale bar, 5 µm) are the transverse sections of whole-mount stained larvae on the left (scale bar, 20 µm). Asterisks denote the lumens of pronephric ducts. Arrows indicate the basolateral cell surface. (C) In situ hybridization at 48 hpf shows that l-plastin-positive cells were increased after injection of LipL32 and the response was blocked by morpholino knockdown of tlr2 but not tl4a and tl4b. The insets are enlarged views of the corresponding regions of pronephric ducts. Scale bar, 200 µm. The diagram indicates the frequencies of strong and weak staining of l-plastin with different MOs (n = 27 to 101 from three experiments, ***P < 0.0001 versus LipL32 protein). |
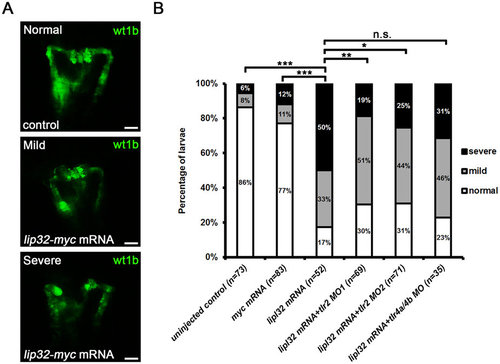
TLR2 blockade ameliorated the kidney injury induced by LipL32. (A) Pronephric kidney injuries were induced in the lipl32 mRNA-injected wt1b:GFP larvae at 48 hpf. Representative images of normal, mild and severe deformities in pronephros are shown. Morphological deformities were assessed according to the criteria described in Methods. Photos were collected under fluorescence microscopy (dorsal view, anterior to the top). Scale bar, 50 µm. (B) Morpholino (MO) knockdown of tlr2 but not tlr4a and tlr4b significantly attenuated the LipL32-induced kidney injuries. The diagram indicates the frequencies of normal, mild and severe deformities in the wt1b:GFP larvae microinjected with different TLR MOs (n = 32 to 83 from three experiments, *P < 0.05, **P < 0.01, ***P < 0.001 versus lipl32 mRNA, n.s., not significant). |