- Title
-
Intracellular Golgi Complex Organization Reveals Tissue Specific Polarity during Zebrafish Embryogenesis
- Authors
- Sepich, D.S., Solnica-Krezel, L.
- Source
- Full text @ Dev. Dyn.
|
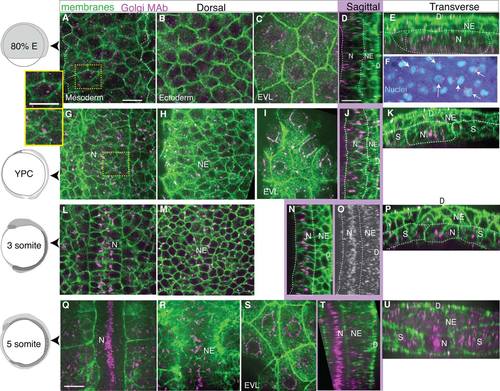
Dynamic intracellular organization and position of the Golgi Complex monitored by monoclonal antibody labeling of endogenous GM130 protein, a cis-Golgi compartment protein. GM130 in magenta, cell membranes in green. Left column: age of embryos. A-F: Mid-gastrulation embryo (80% epiboly, 8.3 hpf). A: Dorsal mesoderm, inset: one cell. B: Neurectoderm. C: Enveloping layer. D: Notochord in sagittal view. E: Transverse view, line on notochord, adaxial mesoderm, neurectoderm. F: Arrows indicate nuclei with perinuclear GC, nuclei in cyan. G-K: Late gastrulation-stage embryo (YPC, 9.5 hpf). G: Notochord, inset: one cell. H: Neural plate. I: EVL. J: Sagittal view of notochord, neural plate, line on notochord. K: Transverse view, line at notochord, adaxial mesoderm, and neural plate. L-P: 3 somite stage embryo (11 hpf). L: Notochord and somites. M: Neural plate. N: Sagittal view of notochord and neural plate. O: Z-projected sagittal view of the GC in notochord. P: Transverse view, notochord, somites, neural plate. Q-U: 5 somite stage embryo (11.7 hpf). Q: Notochord and somites. R: Ventral neural plate. S: EVL. T: Sagittal view of notochord and neural plate. U: Transverse view, notochord, somites, and neural plate. D, dorsal; N, notochord; NE, neurectoderm; S, somites or paraxial mesoderm. Scale bars = 20 µm. |
|
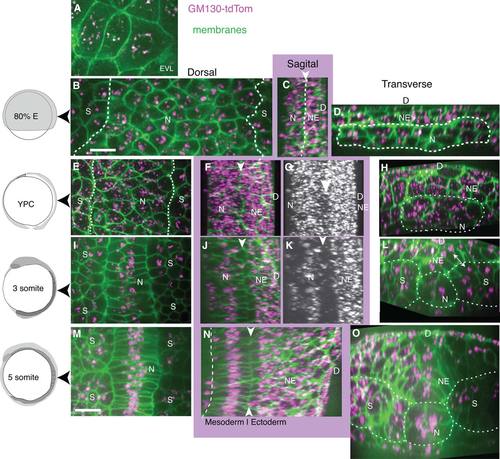
Dynamic intracellular organization and position of the Golgi Complex revealed by GM130-TdTomato fusion protein during zebrafish gastrulation. Left column: Embryo age. A-D: Mid-gastrulation embryo (80% epiboly, 8.3 hpf). All images show Z-projection of GC shown on cell membrane from one plane, except as noted. A: EVL, z-projected 2 slices. B: Notochord and presomitic mesoderm, line at notochord/presomitic mesoderm boundary. C: Sagittal view of notochord and neuroectoderm with arrowhead and line between. D: Transverse view of notochord and neuroectoderm, line surrounding notochord. E-H: Late-gastrulation embryo (YPC, 9.5 hpf). E: Notochord and presomitic mesoderm, line at notochord/presomitic mesoderm boundary. F,G: Sagittal views. F: White arrowhead at notochord/neuroectoderm boundary. G: Z-projected GC, arrowhead indicates forming gap between notochord and neural plate. H: Transverse view, with line around notochord. I-L: 3 somite stage embryo, (11 hpf). I: Notochord and somites J,K: Sagittal views, white arrowhead at notochord/neuroectoderm boundary. L: Transverse view, line marks somites, notochord, and double arrowhead notes position of the GC in neural plate and somite cells. M-O: 5 somite stage embryo (11.7 hpf). M: Notochord and somites. N: Sagittal view, line marks ventral notochord and white arrowheads dorsal notochord. O: Transverse view, line marks boundaries of notochord, somites, and neural plate. N, notochord; NE, neuroectoderm or neural plate; S, somites; D, dorsal. Scale bars = 20 µm. |
|
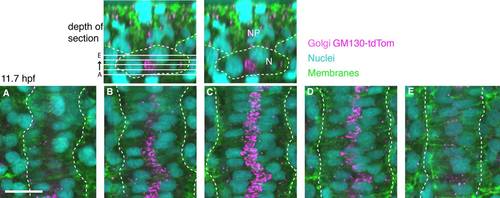
The GC position relative to the nucleus in notochord cells. Top: Transverse views of dorsal side of 5 somite stage wild-type with notochord and somites outlined. Left: Location of sections. Right: Notochord (N), neural plate (NP). A-E: Confocal optical slices spaced 2.5 µm apart. GC (antibody to GM130, magenta), nuclei (DAPI, cyan), and cell membranes (green). Dotted white line highlights lateral edges of the notochord. Scale bar = 20 µm. |
|
Polarized intracellular location of the GC in 3 somite stage wild-type embryos. A-F: Images of GM130-TdTomato/membraneGFP expressing embryos, average width in cell number noted. G: Example of somite and notochord cells. H, top: Method for scoring presence of Golgi in medial and/or lateral region of cell. H, bottom: Percentage of cells with the GC in medial (blue) or lateral (red) region of notochord cell. Line is at 50% of cells. Numbers on bars indicate n = cells. I, left: Method for scoring presence of Golgi in anterior (red) and/or posterior (blue) half of cell. I, right: Percentage of cells with the GC in anterior and/or posterior region of notochord cell. Line is at 50% of cells. Numbers on bars indicate n = cells. Scale bar = 20 µm. |
|
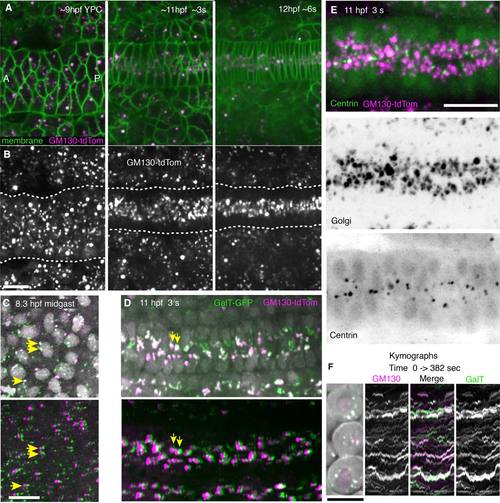
Dynamic behavior of GC and co-localization of GM130 with GalT or centrosomes. A,B: Images from a time-lapse movie showing dynamic changes in GM130 distribution when the notochord converges and notochord cells become polarized. A: GM130 (cis-Golgi marker, magenta) and membrane-GFP (green). B: GM130 label alone. C,D: GM130 (cis-Golgi marker, magenta) and GalT (trans-Golgi marker, green) co-localize within the same Golgi bodies. Nuclei (gray). Yellow arrows indicate co-localized cis- and trans-Golgi puncta in top panel and same puncta shifted by ~2 µm in bottom panel to reveal co-localization of dim puncta. C: Mid-gastrulation, (80% epiboly, 8 hpf). C, top: GM130 and GalT with nuclei. C, bottom: GalT image shifted by ~2 µm. D: Early somitogenesis stage (3 somite, 11 hpf) showing notochord. D, top: GM130 and GalT with nuclei. D, bottom: GalT image shifted by ~2 µm. E: GC and centrosomes in notochord at 11 hpf (3 somite). E, top: Merged GFP-Xcentrin (green) and GM130tdTomato images (magenta). E, middle: Golgi (GM130). E, bottom: GFP-Xcentrin. F: Cells at 7 hpf (60% epiboly) expressing GM130 (magenta) and GalT (green). Kymographs from time-lapse movies of these cells show GC puncta from 0 to 382 seconds in movie. Ant, anterior; P, posterior. Scale bars = 20 µm. |
|
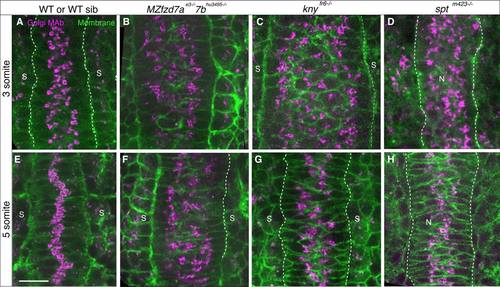
Golgi Complex condensation and intracellular polarity in embryos deficient in Wnt/PCP signaling and somitic mesoderm. 3 somite (11 hpf) (A-D) and 5 somite stage (11.7 hpf) (E-H) embryos labeled with GM130 antibody (magenta) and cell membranes (green) A,E: WT (spt sibling). B,F: fzd7ae3/e3;fzd7b hu3495/. C,G: knyfr6/fr6 D,H: sptm423/m423. Scale bars = 20 µm. |
|
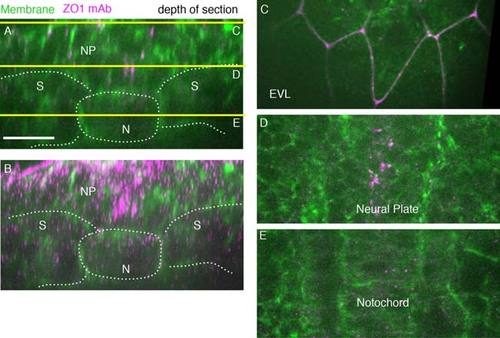
ZO1 antibody-labeled tight junctions in 5 somite stage wild-type embryo (11.7 hpf). A: A single-transverse-plane ZO1 antibody (magenta) cell membranes (green, Transgene [actb::Myosinl12-GFP]). Yellow lines show depth of sections in C,D,E. Dorsal is to the top. Lines mark tissue boundaries. B: Transverse z-projected section of wild-type embryo (spt sibling). C: EVL cells. D: Ventral neural plate. E: Notochord. N, notochord; NP, neural plate; S, somites. Scale bars = 20 µm. |

