
Fig. 4
- ID
- ZDB-IMAGE-160606-13
- Publication
- Sepich et al., 2016 - Intracellular Golgi Complex Organization Reveals Tissue Specific Polarity during Zebrafish Embryogenesis
- All Figures
- Figures for Sepich et al., 2016
|
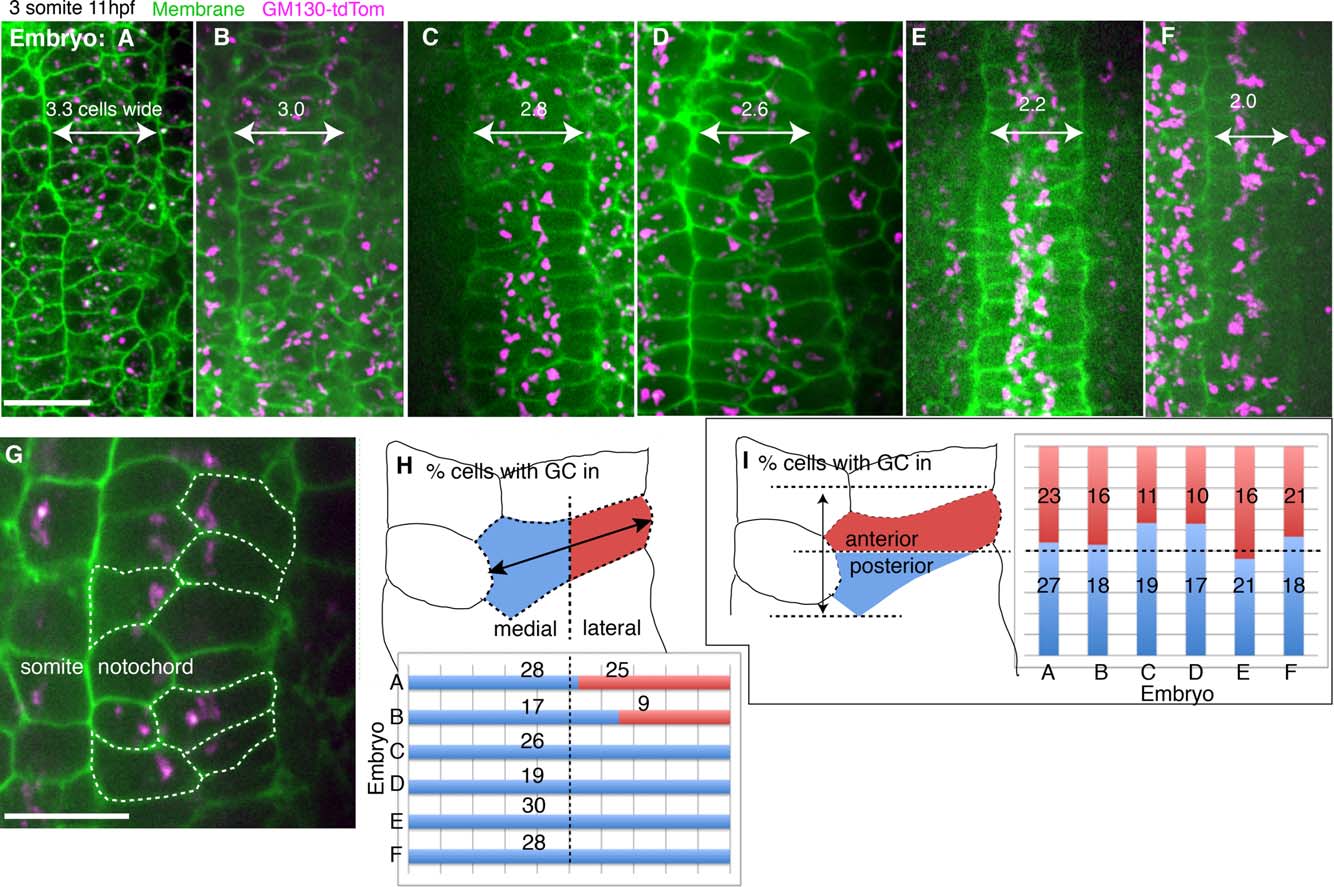
Fig. 4
Polarized intracellular location of the GC in 3 somite stage wild-type embryos. A-F: Images of GM130-TdTomato/membraneGFP expressing embryos, average width in cell number noted. G: Example of somite and notochord cells. H, top: Method for scoring presence of Golgi in medial and/or lateral region of cell. H, bottom: Percentage of cells with the GC in medial (blue) or lateral (red) region of notochord cell. Line is at 50% of cells. Numbers on bars indicate n = cells. I, left: Method for scoring presence of Golgi in anterior (red) and/or posterior (blue) half of cell. I, right: Percentage of cells with the GC in anterior and/or posterior region of notochord cell. Line is at 50% of cells. Numbers on bars indicate n = cells. Scale bar = 20 µm.