
Fig. 5
- ID
- ZDB-FIG-160606-7
- Publication
- Sepich et al., 2016 - Intracellular Golgi Complex Organization Reveals Tissue Specific Polarity during Zebrafish Embryogenesis
- Other Figures
- All Figure Page
- Back to All Figure Page
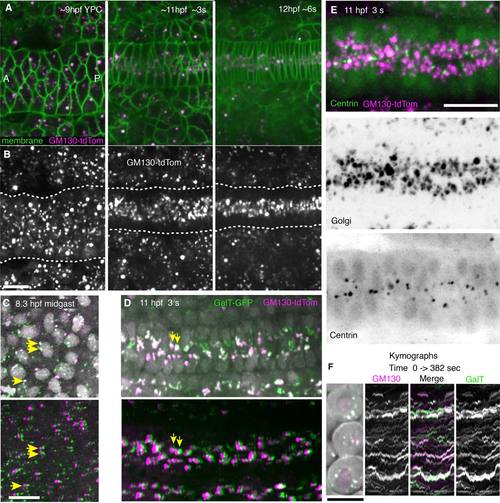
Dynamic behavior of GC and co-localization of GM130 with GalT or centrosomes. A,B: Images from a time-lapse movie showing dynamic changes in GM130 distribution when the notochord converges and notochord cells become polarized. A: GM130 (cis-Golgi marker, magenta) and membrane-GFP (green). B: GM130 label alone. C,D: GM130 (cis-Golgi marker, magenta) and GalT (trans-Golgi marker, green) co-localize within the same Golgi bodies. Nuclei (gray). Yellow arrows indicate co-localized cis- and trans-Golgi puncta in top panel and same puncta shifted by ~2 µm in bottom panel to reveal co-localization of dim puncta. C: Mid-gastrulation, (80% epiboly, 8 hpf). C, top: GM130 and GalT with nuclei. C, bottom: GalT image shifted by ~2 µm. D: Early somitogenesis stage (3 somite, 11 hpf) showing notochord. D, top: GM130 and GalT with nuclei. D, bottom: GalT image shifted by ~2 µm. E: GC and centrosomes in notochord at 11 hpf (3 somite). E, top: Merged GFP-Xcentrin (green) and GM130tdTomato images (magenta). E, middle: Golgi (GM130). E, bottom: GFP-Xcentrin. F: Cells at 7 hpf (60% epiboly) expressing GM130 (magenta) and GalT (green). Kymographs from time-lapse movies of these cells show GC puncta from 0 to 382 seconds in movie. Ant, anterior; P, posterior. Scale bars = 20 µm. |