
Fig. 2
- ID
- ZDB-FIG-160606-4
- Publication
- Sepich et al., 2016 - Intracellular Golgi Complex Organization Reveals Tissue Specific Polarity during Zebrafish Embryogenesis
- Other Figures
- All Figure Page
- Back to All Figure Page
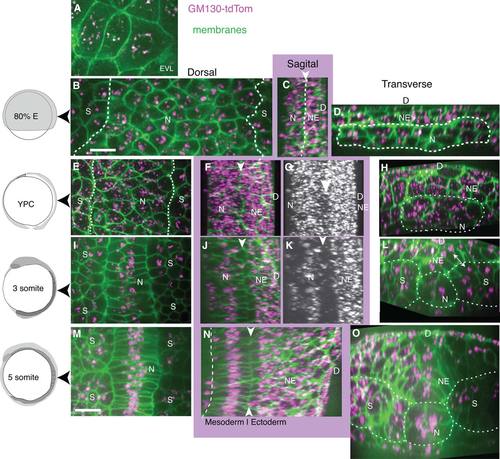
Dynamic intracellular organization and position of the Golgi Complex revealed by GM130-TdTomato fusion protein during zebrafish gastrulation. Left column: Embryo age. A-D: Mid-gastrulation embryo (80% epiboly, 8.3 hpf). All images show Z-projection of GC shown on cell membrane from one plane, except as noted. A: EVL, z-projected 2 slices. B: Notochord and presomitic mesoderm, line at notochord/presomitic mesoderm boundary. C: Sagittal view of notochord and neuroectoderm with arrowhead and line between. D: Transverse view of notochord and neuroectoderm, line surrounding notochord. E-H: Late-gastrulation embryo (YPC, 9.5 hpf). E: Notochord and presomitic mesoderm, line at notochord/presomitic mesoderm boundary. F,G: Sagittal views. F: White arrowhead at notochord/neuroectoderm boundary. G: Z-projected GC, arrowhead indicates forming gap between notochord and neural plate. H: Transverse view, with line around notochord. I-L: 3 somite stage embryo, (11 hpf). I: Notochord and somites J,K: Sagittal views, white arrowhead at notochord/neuroectoderm boundary. L: Transverse view, line marks somites, notochord, and double arrowhead notes position of the GC in neural plate and somite cells. M-O: 5 somite stage embryo (11.7 hpf). M: Notochord and somites. N: Sagittal view, line marks ventral notochord and white arrowheads dorsal notochord. O: Transverse view, line marks boundaries of notochord, somites, and neural plate. N, notochord; NE, neuroectoderm or neural plate; S, somites; D, dorsal. Scale bars = 20 µm. |