
Fig. 1
- ID
- ZDB-FIG-160606-3
- Publication
- Sepich et al., 2016 - Intracellular Golgi Complex Organization Reveals Tissue Specific Polarity during Zebrafish Embryogenesis
- Other Figures
- All Figure Page
- Back to All Figure Page
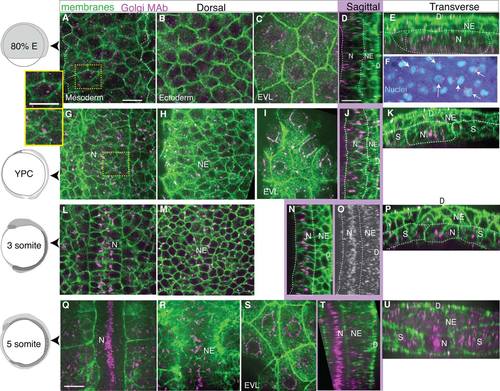
Dynamic intracellular organization and position of the Golgi Complex monitored by monoclonal antibody labeling of endogenous GM130 protein, a cis-Golgi compartment protein. GM130 in magenta, cell membranes in green. Left column: age of embryos. A-F: Mid-gastrulation embryo (80% epiboly, 8.3 hpf). A: Dorsal mesoderm, inset: one cell. B: Neurectoderm. C: Enveloping layer. D: Notochord in sagittal view. E: Transverse view, line on notochord, adaxial mesoderm, neurectoderm. F: Arrows indicate nuclei with perinuclear GC, nuclei in cyan. G-K: Late gastrulation-stage embryo (YPC, 9.5 hpf). G: Notochord, inset: one cell. H: Neural plate. I: EVL. J: Sagittal view of notochord, neural plate, line on notochord. K: Transverse view, line at notochord, adaxial mesoderm, and neural plate. L-P: 3 somite stage embryo (11 hpf). L: Notochord and somites. M: Neural plate. N: Sagittal view of notochord and neural plate. O: Z-projected sagittal view of the GC in notochord. P: Transverse view, notochord, somites, neural plate. Q-U: 5 somite stage embryo (11.7 hpf). Q: Notochord and somites. R: Ventral neural plate. S: EVL. T: Sagittal view of notochord and neural plate. U: Transverse view, notochord, somites, and neural plate. D, dorsal; N, notochord; NE, neurectoderm; S, somites or paraxial mesoderm. Scale bars = 20 µm. |