
- Title
-
JNK Inhibition Inhibits Lateral Line Neuromast Hair Cell Development
- Authors
- Cai, C., Lin, J., Sun, S., He, Y.
- Source
- Full text @ Front. Cell. Neurosci.

Figure 1. SP600125 reduced the number of FM1−43FX+ cells. (A–C) We treated 3 dpf zebrafish with or without SP600125 for 2 days and subsequently imaged FM1-43FX+ cells (red). Higher magnification of hair cells of the neuromast taken from z-stacks show that (A) hair cells in untreated controls and (B,C) SP600125-treated animals had no observable morphological differences though there were fewer hair cells in the SP600125-treated animals. Nuclei are stained with DAPI and scale bars = 10 μm. (D) The average number of FM1−43FX+ cells per neuromast (NM) in larvae treated with or without SP600125 for 2 days. The first 4 neuromasts along the body, L1–L4, were recorded on one side of each fish. n = 26 neuromasts in control, n = 28 in 5 μM SP600125-treated neuromasts, n = 40 in 10 μM SP600125-treated neuromasts, and n = 28 in 15 μM SP600125-treated neuromasts. One-way ANOVA; FM1−43FX+ cells: F3, 118 = 96.18, p < 0.001. Bars are mean ± SD. ***p < 0.001, highly significant difference when compared to control larvae. |
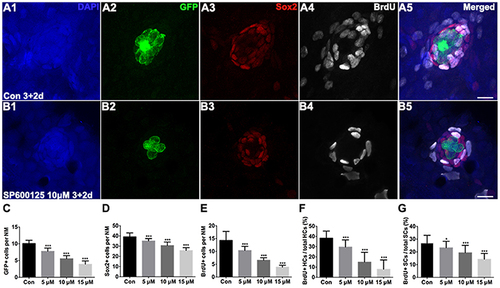
Figure 2. Detection of neuromast hair cells and supporting cells in 5 dpf larvae. (A,B) Confocal images of neuromasts from a 5 dpf control larva and 5 dpf larva treated with 10 μM SP600125. The neuromast hair cells in the transgenic line Brn3c:mGFP were detected by GFP visualization (green), supporting cells were detected by Sox2 (red), and proliferating cells were detected by BrdU (white). Higher magnification of hair cells and supporting cells of the neuromast taken from z-stacks show that hair cells and supporting cells in untreated controls and SP600125-treated animals had no observable morphological differences though there were fewer GFP-positive and Sox2-positive cells in the neuromasts of larvae treated with SP600125. The number of BrdU-labeled cells is much larger in control than in SP600125-treated larvae. Scale bar = 10 μm. (C,D) Quantification of hair cells and supporting cells in the neuromast (NM) for each experimental condition. (E–G) Quantification of replicating cells in the neuromasts for each experimental condition. SP600125 treatment decreased the numbers of BrdU-positive cells, the ratio of BrdU-positive hair cells, and the ratio of BrdU-positive supporting cells in neuromasts. The first four neuromasts along the body, L1–L4, were recorded on one side of each fish [one-way ANOVA; GFP+ cells: F(3, 112) = 237.5, p < 0.001; Sox2+ cells: F(3, 112) = 102.5, p < 0.001; BrdU+ cells: F(3, 112) = 134, p < 0.001; BrdU+ HCs: F(3, 112) = 89.7, p < 0.001; BrdU+ SCs: F(3, 111) = 32.08, p < 0.001]. Bars are mean ± SD. n = 36 neuromasts in control, n = 28 in 5 μM SP600125-treated neuromasts, n = 24 in 10 μM SP600125-treated neuromasts, and n = 28 in 15 μM SP600125-treated neuromasts. *p < 0.05, significant difference when compared to control larvae; ***p < 0.001, highly significant difference when compared to control larvae. |
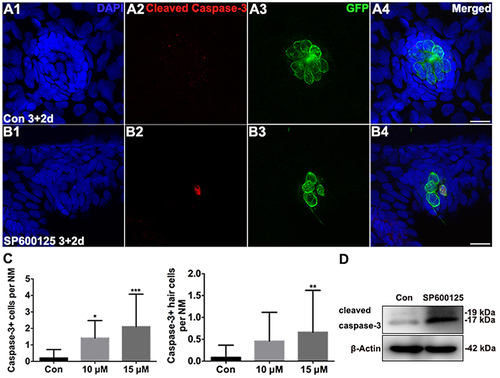
Figure 3. Effects of SP600125 on apoptosis. (A–B) Cleaved caspase-3 staining in the neuromast from a 5 dpf control larva (A) and 15 μM SP600125-treated 5 dpf larva (B). Scale bar = 10 μm. (C) SP600125 treatment increased the numbers of cleaved caspase−3−positive cells and cleaved caspase−3−positive hair cells [one-way ANOVA; Caspase−3+ cells: F(2, 101) = 12.53, p < 0.001; Caspase3+ hair cells: F(2, 101) = 4.549, p = 0.0128]. Bars are mean ± SD. n = 24 neuromasts in control, n = 24 in 10 μM SP600125-treated neuromasts, and n = 56 in 15 μM SP600125-treated neuromasts. *p < 0.05, significant when compared to control larvae; **p < 0.01, highly significant when compared to control larvae; ***p < 0.001, highly significant when compared to control larvae. (D) After treatment of 3 dpf larvae with 15 μM SP600125 for 2 days, protein extracts were prepared and subjected to western blot assay using an antibody against cleaved caspase-3. β-Actin was included as the loading control. |
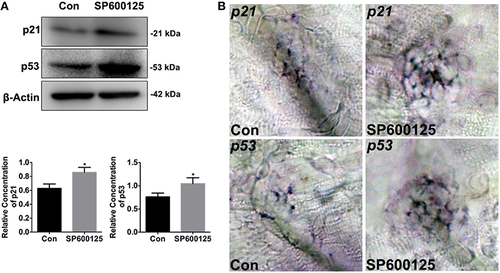
Figure 4. Effects of SP600125 on the expression of p21 and p53. (A) After treatment of larvae with 10 μM SP600125 for 2 days, protein extracts were prepared and subjected to western blot assay using antibodies against p21 and p53. β-Actin was included as the control. (p21, unpaired t-test, two-tailed, t = 4.172, df = 4, p = 0.014; p53, unpaired t-test, two-tailed, t = 3.273, df = 4, p = 0.0307).Bars are mean ± SD for three experimental replicates. *p < 0.05. (B) Localization of p21 and p53 genes with whole-mount in situ hybridization in SP600125-treated and untreated larvae. |
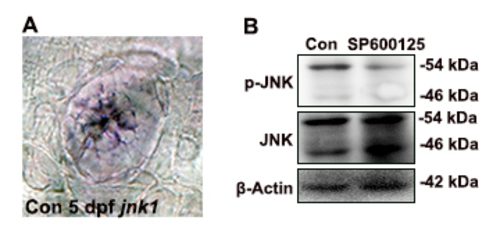
Pattern of JNK phosphorylation during hair cell development. (A) Expression pattern of jnk1 in the neuromast of zebrafish at 5 dpf. (B) Extracts from control larvae and SP600125-treated larvae at 5 dpf were run on SDS-PAGE and western blotted with the anti-phosphorylated JNK antibodies. JNK phosphorylation was detected in the control larvae at 5 dpf, but p-JNK was obviously down-regulated after SP600125 treatment. |
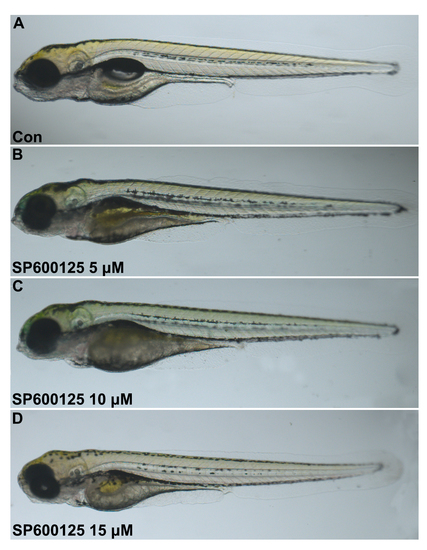
Effect of JNK inhibition on the development of zebrafish larvae. Full-body images of 5 dpf zebrafish larvae exposed to 0μM (control) (A), 5μM (B), 10μM (C), and 15μM SP600125 (D) during the 3–5 dpf period of hair cell development. The zebrafish larvae treated with 5μM SP600125 from 3 to 5 dpf were morphologically normal when compared to control larvae while more defects were observed in the 15μM-treated larvae, such as pericardium edema and reduced total length. |
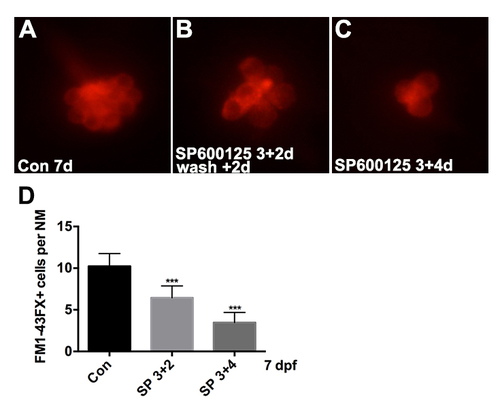
Effects of varying duration of SP600125 exposure on hair cell number during the period of embryonic development. (A) Control group; (B) larvae at 3 dpf were treated with 10μM SP600125 for 4 days; (C) larvae at 3 dpf were treated with 10μM SP600125 for 2 days, after which the inhibitor was washed out and hair cells were analyzed after another 2 days. (D) Quantification of FM1-43FX+ hair cells in the neuromast (NM) for each experimental condition [One-way ANOVA; F(2, 117) = 234.9, p < 0.001]. Bars are mean ± SD. n = 36-44 neuromasts per treatment. ***p < 0.001. |
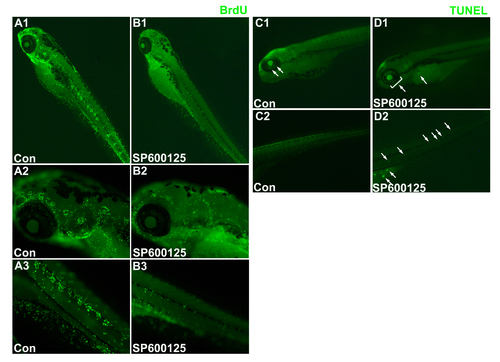
Effects of JNK inhibition on proliferation and apoptosis in the entire zebrafish. Detection of cell proliferation (A,B) and apoptosis (C,D) in the entire zebrafish (5 dpf) exposed to 0μM (control) (A,C), or 15μM SP600125 (B,D). |