
- Title
-
Intraciliary Calcium Oscillations Initiate Vertebrate Left-Right Asymmetry
- Authors
- Yuan, S., Zhao, L., Brueckner, M., Sun, Z.
- Source
- Full text @ Curr. Biol.
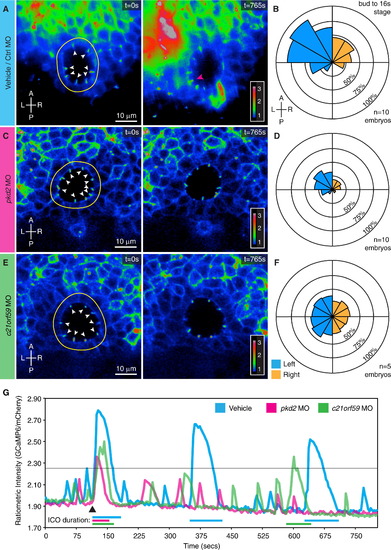
Cilia-Targeted GECIs Reveal the Presence of ICOs in the LRO of Zebrafish that Are Leftward Biased and Dependent on Pkd2 and Ciliary Motility (A-F) Spatial mapping of ICOs in the zebrafish LRO. (A, C, and E) Representative fluorescent live images of the LRO from vehicle-injected (A), pkd2 morphant (MO) (C), and c21orf59 morphant (E) zebrafish embryos at the one-somite stage expressing ratiometric GECI (arl13b-GCaMP6/mCherry) (ratiometric signal is shown and false colored with a rainbow intensometric scale). White arrowheads indicate LRO cilia at resting state, whereas the magenta arrowhead (A) highlights an ICO inducing a cytosolic calcium wave. The scale bars represent 10 µm. (B, D, and F) Rose diagrams depicting the spatial distribution and mean percentage of cells per embryo displaying ICOs in the total LRO of vehicle (B), pkd2 MO (D), and c21orf59 MO (F) embryos spanning the entire course of LRO development (bud to 16-somite stage). Rings correlate with the mean percentage of cells exhibiting calcium oscillations per embryo from bud to 16-somite stage (n = 10 embryos at all stages for pkd2 and vehicle; n = 5 embryos for c21orf59 and vehicle). Control and experimental samples were acquired in a pairwise manner, and analysis was performed on time-lapse recordings spanning bud to 16-somite stage. Control samples for c21orf59 morphants are not shown, because the distribution and frequency were equivalent to controls for pkd2 morphants. Left-sided calcium, blue; right-sided calcium, orange. (G) Intraciliary calcium at the LRO exhibits an oscillation-like dynamic. Ratiometric intensity over time plot of a single cilium exhibiting ICOs in vehicle (blue), pkd2 MO (magenta), and c21orf59 MO (green) LROs at the one- to four-somite stage. Each plot was aligned postacquisition to the first detected ICOs (indicated by the black arrowhead) and thresholded (indicated by the black horizontal line) to facilitate analysis of calcium oscillation dynamics. A, anterior; P, posterior; L, left; R, right. See also Figures S2 and S3 and Movies S1, S2, and S3. PHENOTYPE:
|
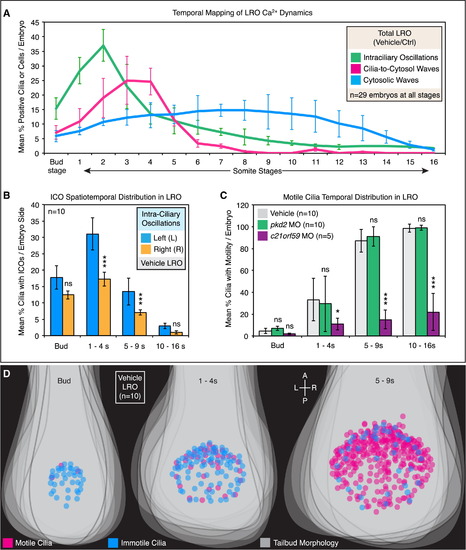
ICOs Are Spatiotemporally Asymmetric and Coincide with the Initiation of Cilia Motility in the LRO (A) Temporal mapping of the mean percentage of cells exhibiting calcium activity in vehicle LROs (n = 29 embryos) from bud stage to 16-somite stage. Calcium activity in the LRO was categorized as ICOs (green), cilia-to-cytosolic waves (magenta), or cytosolic waves (cyan). (B) Spatiotemporal mapping of the mean percentage of cells per embryo exhibiting ICOs on the left or right side of the LRO in vehicle embryos (n = 10 embryos) during bud, 1- to 4-somite, 5- to 9-somite, and 10- to 16-somite stages. Left-sided calcium oscillations, blue; right-sided calcium oscillations, orange. (C and D) Spatiotemporal mapping of two cilia populations in the zebrafish LRO. (C) Temporal mapping of the mean percentage of motile cilia in vehicle (gray), pkd2 MO (green), and c21orf59 MO (violet) LROs over the course of LRO development. (D) Additive projections of motile (magenta) and immotile (cyan) cilia from vehicle embryos over the course of LRO development. Tailbud area and morphology (gray) of corresponding LROs are also assembled by additive projections. *p < 0.05, ***p < 0.0005; ns (not significant): p ≥ 0.05. All data shown are mean ± SEM. See also Figure S4. PHENOTYPE:
|
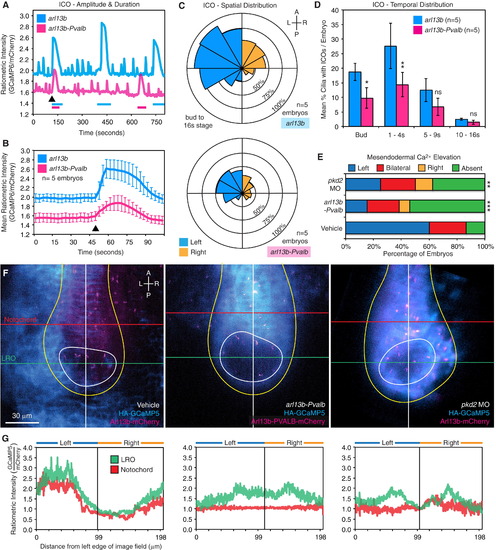
ICOs Are Required for Establishing Asymmetric Mesendodermal Calcium at the LRO (A-D) Suppression of ICOs by arl13b-Pvalb. (A and B) Ratiometric intensity (Arl13b-GCaMP6/mCherry) over time plot of a single cilium from a representative embryo (A) or a mean trace representing five embryos (B) exhibiting ICOs in arl13b (cyan) and arl13b-Pvalb (magenta) LROs at the one- to four-somite stage. Each plot was aligned postacquisition to the first detected ICOs (indicated by the black arrowheads) and thresholded to facilitate analysis of calcium oscillation dynamics. Error bars are mean ± SEM. (C) Rose diagrams depicting the spatial distribution and mean percentage of cells per embryo displaying ICOs in the total LRO of arl13b (upper) and arl13b-Pvalb (lower) embryos spanning the entire course of LRO development (bud to 16-somite stage). Rings correlate with the mean percentage of cells exhibiting calcium oscillations per embryo (n = 5 embryos at all stages for arl13b and arl13b-Pvalb). Control and experimental samples were acquired in a pairwise manner, and analysis was performed on time-lapse recordings spanning bud to 16-somite stage. Left-sided calcium, blue; right-sided calcium, orange. (D) Temporal mapping of the mean percentage of cells exhibiting ICOs per embryo in the entire LRO in arl13b (cyan) and arl13b-Pvalb (magenta) embryos across the entire course of LRO development (bud to 16-somite stage). *p < 0.05, **p < 0.005; ns: p e 0.05. Error bars are mean ± SEM. (E–G) Disruption of mesendodermal calcium by arl13b-Pvalb. (E) Distribution of vehicle, arl13b-Pvalb, and pkd2 MO embryos with normal left, or abnormal right, bilateral, and absent mesendodermal calcium signal at the LRO. pkd2, **p = 0.0033; arl13b-Pvalb, ***p = 0.0002. (F) Representative live fluorescent images depicting cytoplasmic calcium in mesendodermal cells of vehicle, arl13b-Pvalb-mCherry, and pkd2 MO zebrafish embryos at the six- to eight-somite stage. Calcium is visualized with HA-GCaMP5 (cyan) and cilia are identified by Arl13b-mCherry (magenta). The scale bar represents 30 µm. (G) Ratiometric intensity plot (GCaMP5/mCherry) of cytoplasmic mesendodermal calcium levels corresponding to images in (F), relative to the position at the LRO level (green) and posterior notochord level (red) across the left-right axis. See also Figure S5 and Movies S4, S5, and S6. PHENOTYPE:
|
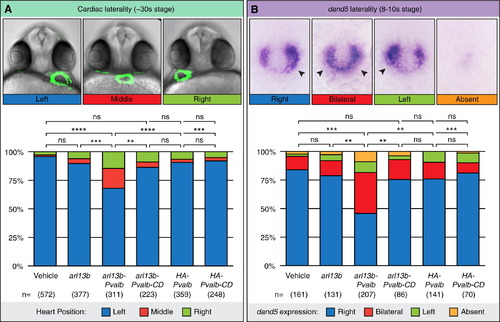
Intraciliary Calcium Is Essential for Vertebrate LR Development (A) Representative bright-field and fluorescent images showing the heart position in zebrafish embryos at <30-somite stage highlighted by a GFP transgene driven by the promoter of cardiac myosin light chain 2. The embryo is seen from the ventral side, showing normal left (blue) and abnormal middle (red) and right (green) heart loops. The graph shows the distribution of heart position in response to expression of parvalbumin and mutant parvalbumin (PVALB-CD) targeted to cilia or cytoplasm of wild-type embryos. Data shown are pooled from nine total independent experiments. (B) Representative images of whole-mount in situ hybridization for dand5 (charon) expression in the LRO of zebrafish embryos at the eight- to ten-somite stage. The embryo is seen from the dorsal side, showing normal right-sided (blue) expression and abnormal bilateral (red), left-sided (green), or absent (orange) expression. Arrowheads indicate handedness of dand5 expression across the left-right axis. The graph shows the distribution of dand5 in response to expression of PVALB and PVALB-CD targeted to cilia or cytoplasm. Data shown are pooled from three independent experiments. Statistical comparison was analyzed by one-way ANOVA with Tukey’s multiple comparison test; p < 0.005, p < 0.0005, p < 0.0001; ns: p e 0.05. n, total number of embryos analyzed for each experimental condition (in parentheses). See also Figure S6. EXPRESSION / LABELING:
|