
Fig. 4
- ID
- ZDB-IMAGE-160804-43
- Publication
- Yuan et al., 2015 - Intraciliary Calcium Oscillations Initiate Vertebrate Left-Right Asymmetry
- All Figures
- Figures for Yuan et al., 2015
|
Fig. 4
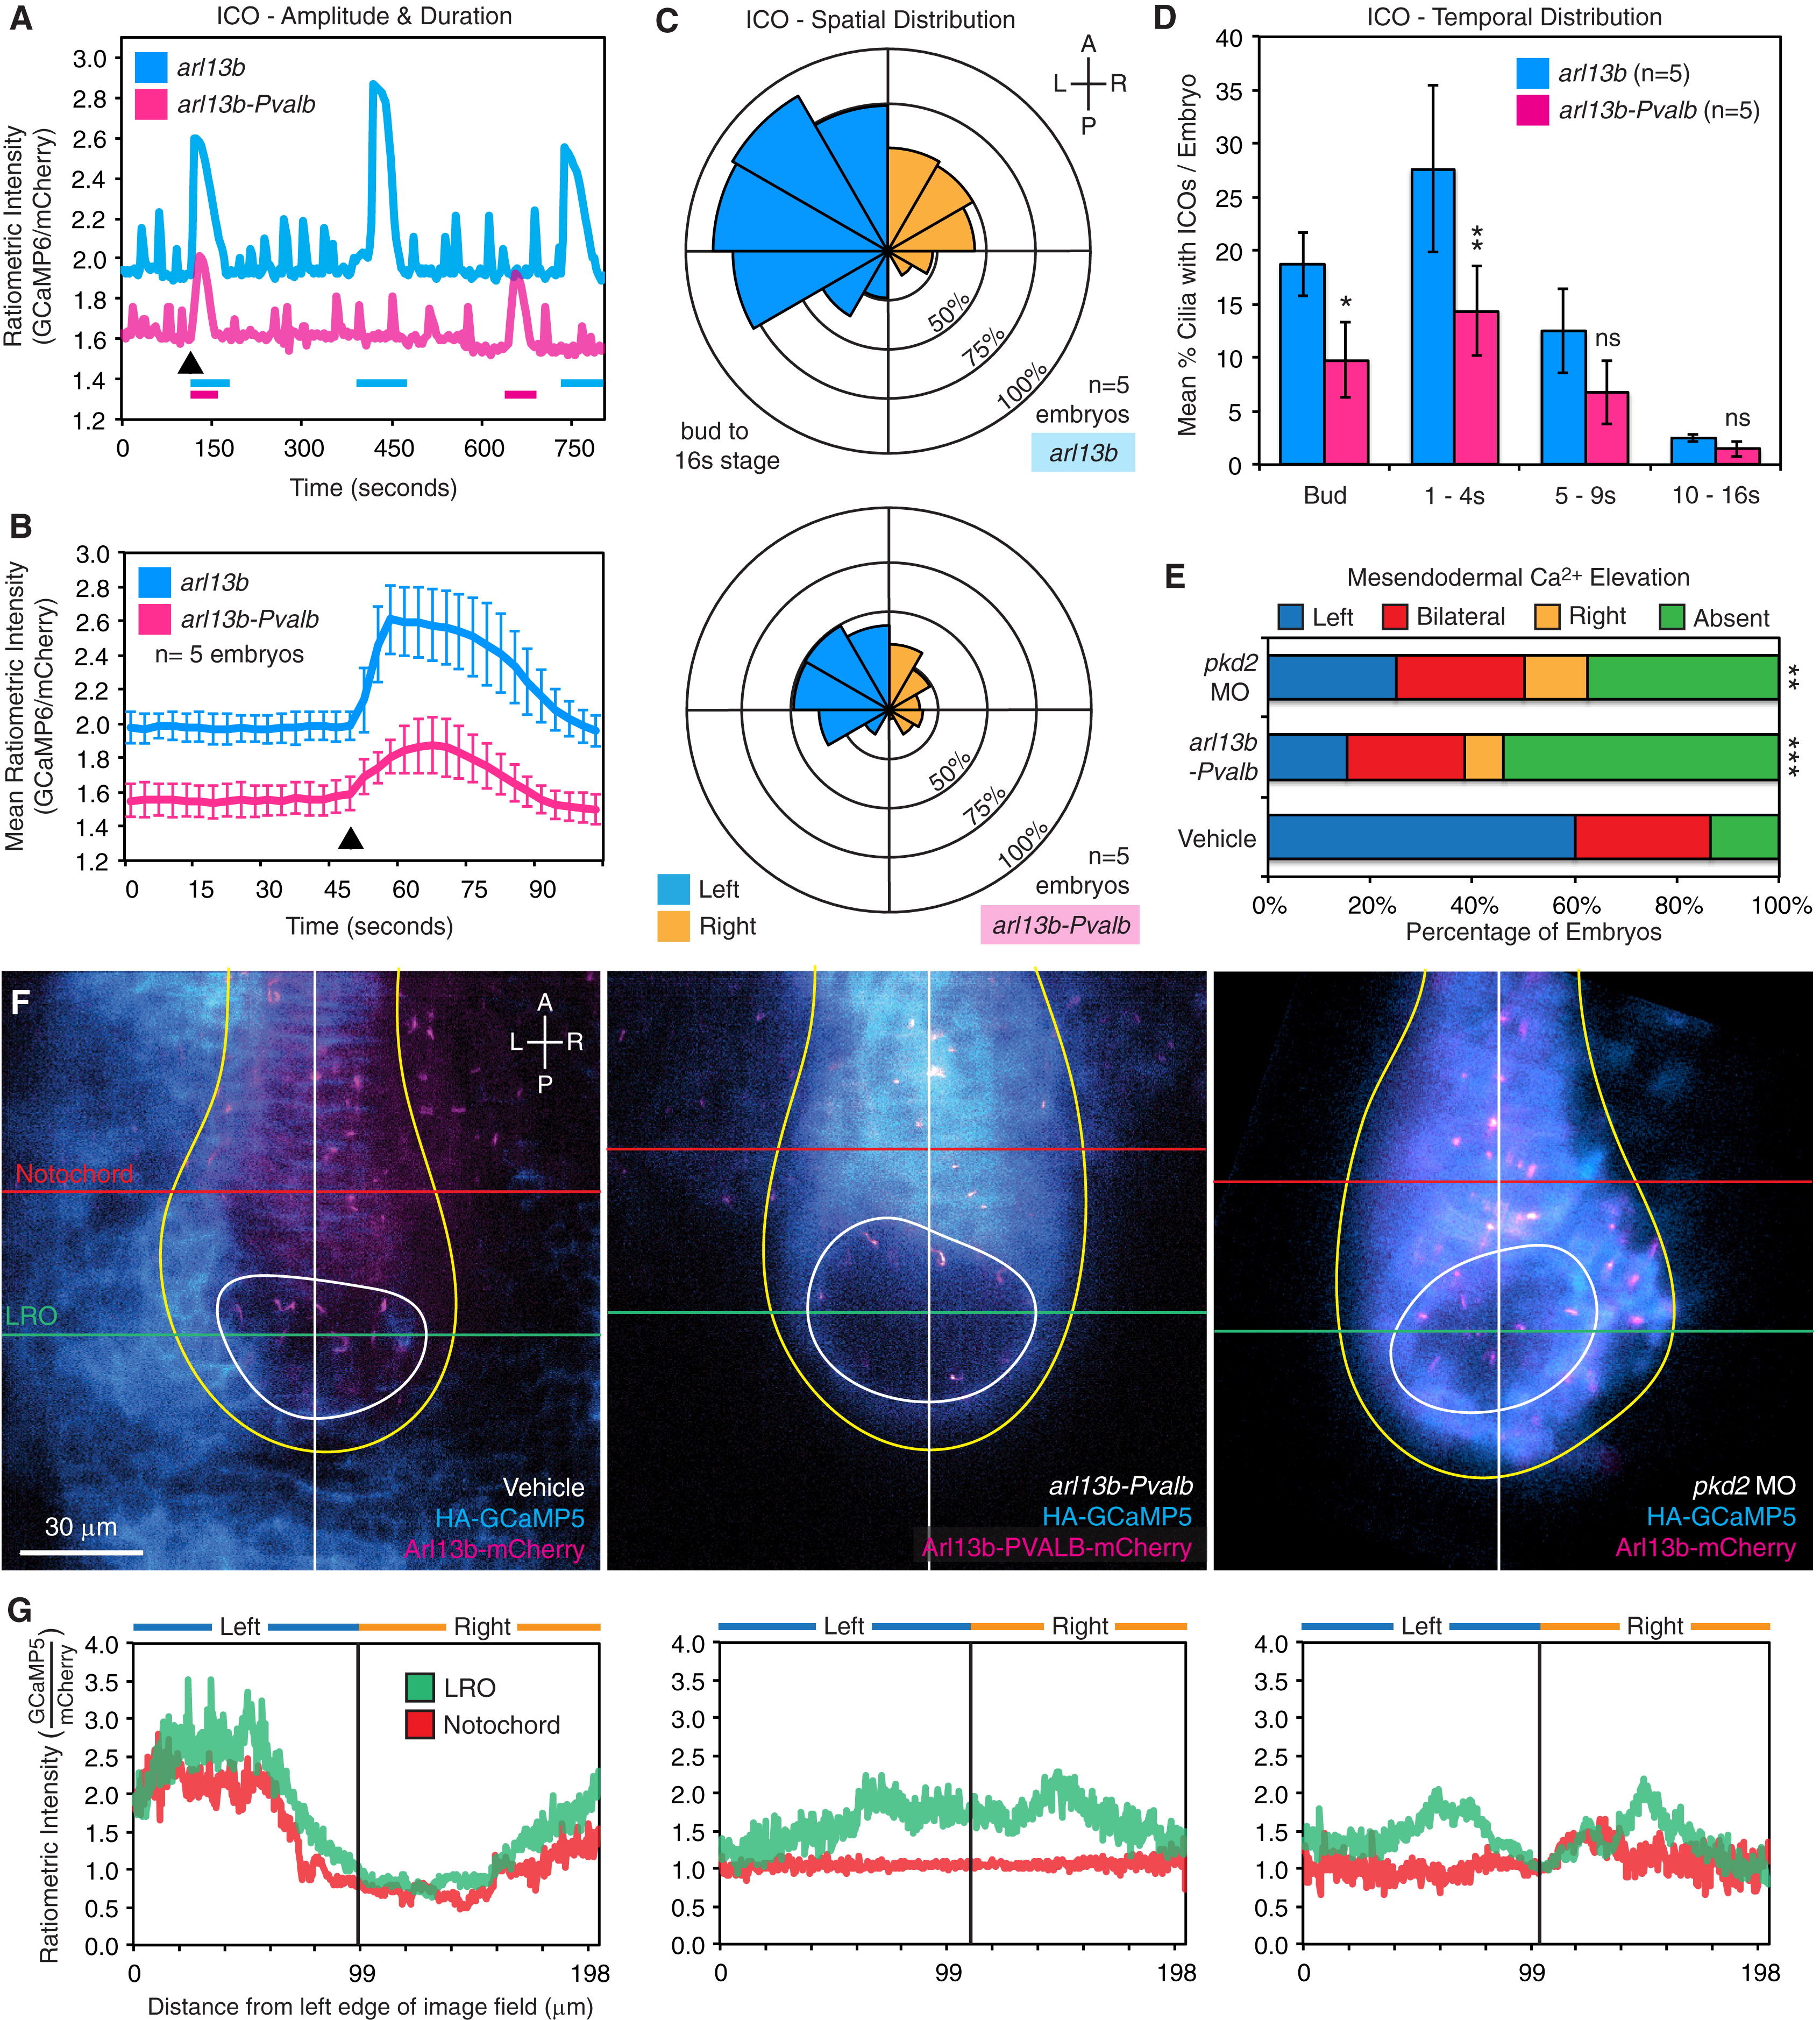
ICOs Are Required for Establishing Asymmetric Mesendodermal Calcium at the LRO
(A-D) Suppression of ICOs by arl13b-Pvalb.
(A and B) Ratiometric intensity (Arl13b-GCaMP6/mCherry) over time plot of a single cilium from a representative embryo (A) or a mean trace representing five embryos (B) exhibiting ICOs in arl13b (cyan) and arl13b-Pvalb (magenta) LROs at the one- to four-somite stage. Each plot was aligned postacquisition to the first detected ICOs (indicated by the black arrowheads) and thresholded to facilitate analysis of calcium oscillation dynamics. Error bars are mean ± SEM.
(C) Rose diagrams depicting the spatial distribution and mean percentage of cells per embryo displaying ICOs in the total LRO of arl13b (upper) and arl13b-Pvalb (lower) embryos spanning the entire course of LRO development (bud to 16-somite stage). Rings correlate with the mean percentage of cells exhibiting calcium oscillations per embryo (n = 5 embryos at all stages for arl13b and arl13b-Pvalb). Control and experimental samples were acquired in a pairwise manner, and analysis was performed on time-lapse recordings spanning bud to 16-somite stage. Left-sided calcium, blue; right-sided calcium, orange.
(D) Temporal mapping of the mean percentage of cells exhibiting ICOs per embryo in the entire LRO in arl13b (cyan) and arl13b-Pvalb (magenta) embryos across the entire course of LRO development (bud to 16-somite stage). *p < 0.05, **p < 0.005; ns: p e 0.05. Error bars are mean ± SEM.
(E–G) Disruption of mesendodermal calcium by arl13b-Pvalb.
(E) Distribution of vehicle, arl13b-Pvalb, and pkd2 MO embryos with normal left, or abnormal right, bilateral, and absent mesendodermal calcium signal at the LRO. pkd2, **p = 0.0033; arl13b-Pvalb, ***p = 0.0002.
(F) Representative live fluorescent images depicting cytoplasmic calcium in mesendodermal cells of vehicle, arl13b-Pvalb-mCherry, and pkd2 MO zebrafish embryos at the six- to eight-somite stage. Calcium is visualized with HA-GCaMP5 (cyan) and cilia are identified by Arl13b-mCherry (magenta). The scale bar represents 30 µm.
(G) Ratiometric intensity plot (GCaMP5/mCherry) of cytoplasmic mesendodermal calcium levels corresponding to images in (F), relative to the position at the LRO level (green) and posterior notochord level (red) across the left-right axis.
See also Figure S5 and Movies S4, S5, and S6.