
Fig. 3
- ID
- ZDB-IMAGE-160804-42
- Publication
- Yuan et al., 2015 - Intraciliary Calcium Oscillations Initiate Vertebrate Left-Right Asymmetry
- All Figures
- Figures for Yuan et al., 2015
|
Fig. 3
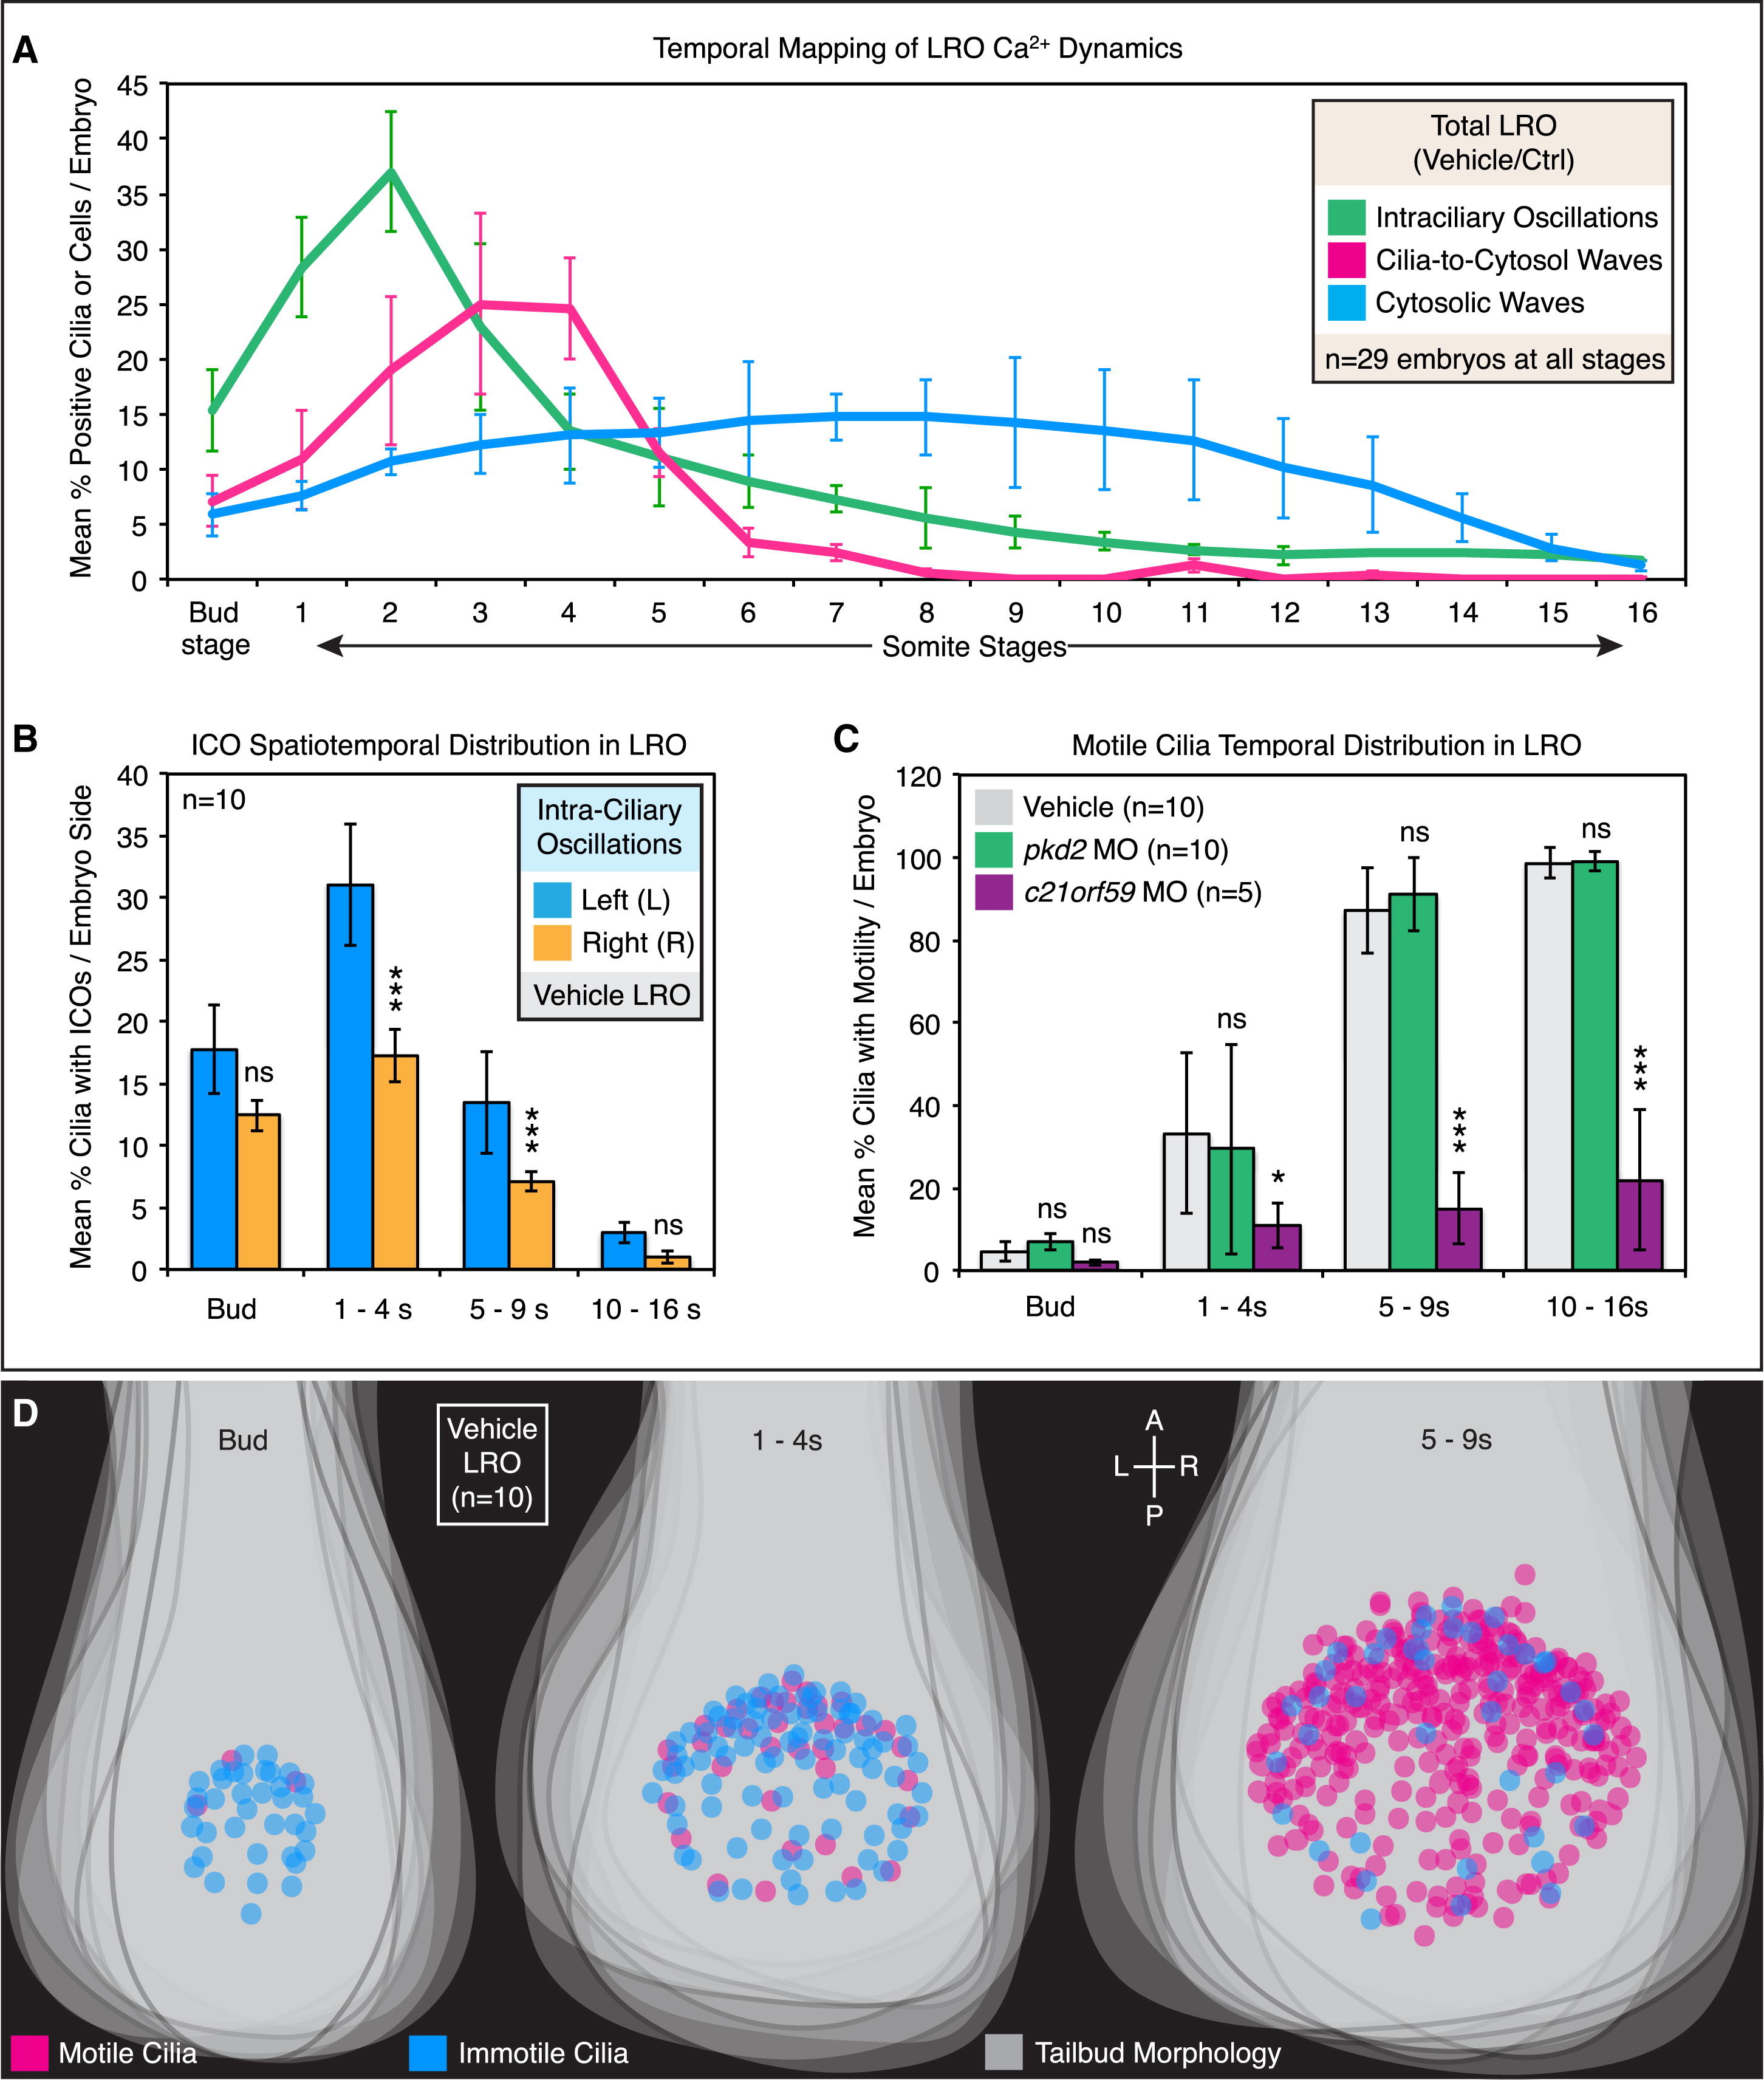
ICOs Are Spatiotemporally Asymmetric and Coincide with the Initiation of Cilia Motility in the LRO
(A) Temporal mapping of the mean percentage of cells exhibiting calcium activity in vehicle LROs (n = 29 embryos) from bud stage to 16-somite stage. Calcium activity in the LRO was categorized as ICOs (green), cilia-to-cytosolic waves (magenta), or cytosolic waves (cyan).
(B) Spatiotemporal mapping of the mean percentage of cells per embryo exhibiting ICOs on the left or right side of the LRO in vehicle embryos (n = 10 embryos) during bud, 1- to 4-somite, 5- to 9-somite, and 10- to 16-somite stages. Left-sided calcium oscillations, blue; right-sided calcium oscillations, orange.
(C and D) Spatiotemporal mapping of two cilia populations in the zebrafish LRO.
(C) Temporal mapping of the mean percentage of motile cilia in vehicle (gray), pkd2 MO (green), and c21orf59 MO (violet) LROs over the course of LRO development.
(D) Additive projections of motile (magenta) and immotile (cyan) cilia from vehicle embryos over the course of LRO development. Tailbud area and morphology (gray) of corresponding LROs are also assembled by additive projections.
*p < 0.05, ***p < 0.0005; ns (not significant): p ≥ 0.05. All data shown are mean ± SEM. See also Figure S4.