
- Title
-
NMDA receptors on zebrafish Mauthner cells require CaMKII-α for normal development
- Authors
- Roy, B., Ferdous, J., Ali, D.W.
- Source
- Full text @ Dev. Neurobiol.
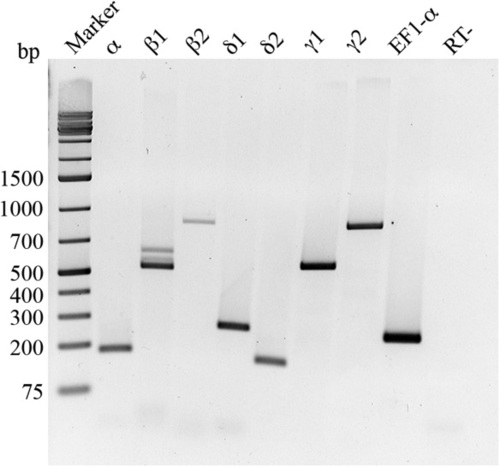
Two dpf zebrafish embryos express all seven CaMKII genes. RNA from 40 embryos was extracted, reverse transcribed, and PCR amplified with eight gene-specific primer pairs. Zebrafish elongation factor 1 alpha (EF1-α) was used as a positive control. RT-: no reverse transcriptase in the reaction. |
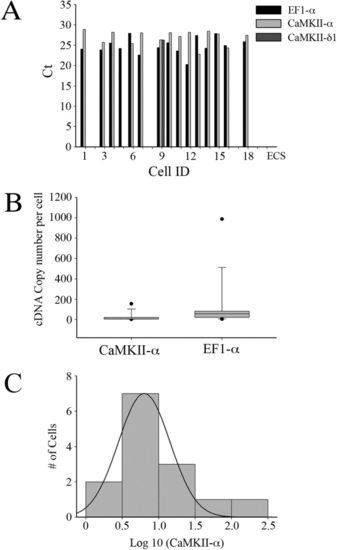
Zebrafish M-cells express CaMKII-α. (A) Ct values of genes expressed in individual M-cell. An arbitrary Ct value of 0 was assigned when any particular gene was undetectable. Note that only one cell (ID: 9) expressed CaMKII-δ1 at detectable level. The control sample consisted of extracellular fluid (ECS) taken from a region surrounding the M-cell. (B) Box plot of quantified copy number of CaMKII-α and EF1-α in single M-cells. The median and 10, 25, 75, and 90 percentiles are plotted. (C) Log-normal distribution of CaMKII-α cDNA. |

Images of 2 dpf zebrafish. (A) uninjected controls, (B) embryos injected with 4 ng of control morpholino, (C) embryos injected with 4 ng of a translation-blocking CaMKII-α morpholino, and (D) embryos injected with 4 ng of a splice-blocking morpholino. (E) RT-PCR blots of CaMKII-α knockdown assessment. EF1-α was used as a loading control. Quantification of blot densities (n = 5 experiments). |
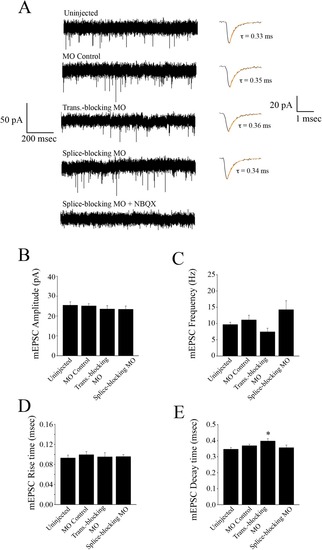
Spontaneous synaptic AMPAR currents obtained from M-cells. (A) Uninjected embryos (n = 7), control morpholino injected embryos (n = 8), translation-blocking morpholino injected embryos (n = 7), and splice-blocking morpholino injected embryos (n = 6) exhibit AMPAR currents at similar frequencies. The inclusion of NBQX (0.1 µM) confirmed the mEPSCs as AMPAR-mediated. Preparations were incubated in TTX (1 µm), strychnine (5 µM), picrotoxin (100 µM), and APV (50 µM) to block action potentials, glycine, GABA and NMDA receptors, respectively. Average traces are shown to the right of each recording; each trace is an average of multiple events; 215 mEPSCs for the uninjected controls, 224 events for the MO controls, 174 events for the translation-blocking morphants, and 276 events for the splice-blocking morphants. Bar graphs comparing the peak amplitude (B), frequency (C), 20–80% rise time (D), and decay time course (E) of averaged AMPA mEPSCs. * Significantly different from uninjected controls, p < 0.05. PHENOTYPE:
|

Spontaneous synaptic NMDAR currents obtained from M-cells. (A) Uninjected embryos (n = 7), control morpholino injected embryos (n = 6), translation-blocking morpholino injected embryos (n = 5), and splice-blocking morpholino injected embryos (n = 5) exhibit NMDAR currents at similar frequencies. The inclusion of APV (50 µM) confirmed the mEPSCs as NMDAR-mediated. Inset shows an example of an individual mEPSC on an expanded time scale. Note the biexponential decay phase of the individual event. Preparations were incubated in TTX (1 µm), strychnine (5 µM), picrotoxin (100 µM), and NBQX (0.1 µM) to block action potentials, glycine, GABA and AMPA receptors, respectively. (B) Averaged mEPSCs recorded from M-cells of an uninjected control, a control MO injected embryo and translation-blocking morpholino injected embryo and a splice-blocking morpholino injected embryo. Each trace is an average of multiple events; 86 mEPSCs for the uninjected controls, 44 events for the MO controls, 58 events for the translation-blocking morphants, and 22 events for the splice-blocking morphants. Bar graphs comparing the peak amplitude (C), frequency (D), and 20–80% rise time (E) of averaged NMDA mEPSCs. * Significantly different from uninjected and MO controls, p < 0.05, ** significantly different from uninjected and MO controls, p < 0.01. PHENOTYPE:
|

NMDA mEPSC kinetics. (A) These averaged traces had biexponential decay phases with τfast = 21 ms and τslow = 319 ms in the uninjected control, τfast = 18 ms and τslow = 316 ms in the MO controls, τfast = 40 ms and τslow = 299 ms for the translation-blocking morphants and τfast = 39 ms and τslow = 221 ms for the splice-blocking morphants. Bar graphs comparing the amplitude of the fast component (B), the decay time constant of the fast component, τfast (C), the amplitude of the slow component (D), and the decay time constant of the slow component, τslow. * Significantly different from uninjected and MO controls, p < 0.05. PHENOTYPE:
|
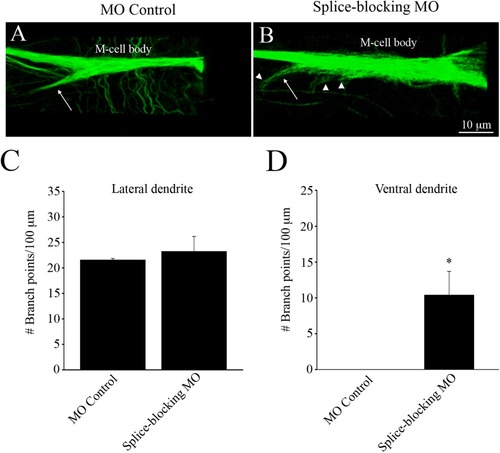
Immunohistochemical images of the M-cell labeled with anti-3A10, from control-injected and splice-blocking morphants. (A) The M-cell of MO control-injected fish. Arrow points to the ventral dendrite. (B) The M-cell of a splice-blocked embryo. Arrow points to the ventral dendrite. Arrowheads point to dendritic arborizations present on the cell body and ventral dendrite. Quantification of the number of branch points per 100 µm, emanating from the lateral dendrites (C) and the ventral dendrites (D). * Significantly different from MO controls, p < 0.05. |

Behavioral data obtained from touch responses of 2 dpf, agar-restrained embryos (A). The times shown on the figures indicate the time from the start of the response at t = 0 ms. (B) Angle of the c-bend ascertained by measuring the degree of rotation of the tail from the unstimulated, start position (t = 0 ms) to the maximum bend angle. (C) Time for the c-bend to occur from the moment the fish starts to respond, to the maximum point of curvature of the tail. (D) Time taken for the tail to move from the end of the c-start to the second bend of the tail. * Significantly different from MO controls, p < 0.05, *** significantly different from MO controls, p < 0.005. PHENOTYPE:
|