
- Title
-
Podocyte developmental defects caused by adriamycin in zebrafish embryos and larvae: a novel model of glomerular damage
- Authors
- Zennaro, C., Mariotti, M., Carraro, M., Pasqualetti, S., Corbelli, A., Armelloni, S., Li, M., Ikehata, M., Clai, M., Artero, M., Messa, P., Boscutti, G., Rastaldi, M.P.
- Source
- Full text @ PLoS One

Adriamycin dose and time-dependent effects. (a) Palb test results showing dose-dependent effects of adriamycin on isolated rat glomeruli. The test is considered positive when Palb values are higher than 0.5 (dashed red line). Asterisks (**) indicate P<0.005 vs NT (NT = Not Treated) and # P<0.05. (b) A representative example of the developmental defects caused by exposure to 10 μM adriamycin at 3 hpf. Images were taken at 24 hpf. As compared to a normally developing embryo (NT, left panel), the adriamycin-treated embryo (ADR) shows severe changes, such as the absence of eye development. Arrows point to the eye in NT embryo and its absence after ADR exposure. (c) Normal development of 24 hpf embryos exposed to 10–40 μM adriamycin (ADR) when ADR is dissolved in the medium at 9 hpf. Treated embryos (panels 2–4) are indistinguishable from the control (panel 1, NT). (d) At 48 hpf, as compared to the control (NT, top panel), fish exposed to adriamycin 10–40 μM start displaying evident dose-dependent pericardial edema (light blue areas). The effect is very mild at the adriamycin dosage of 5 μM (second panel from the top). |
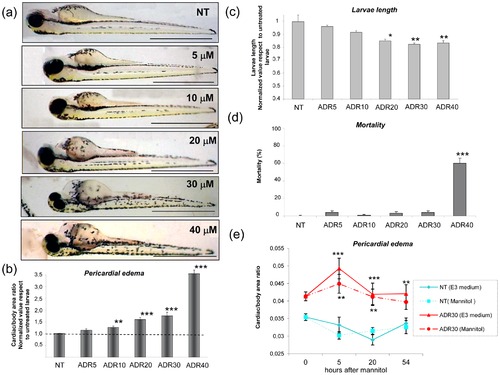
Dose-dependent effects of exposure to adriamycin at 9 hpf. (a) Lateral view of 72 hpf larvae exposed to medium (NT) or to adriamycin. Pericardial edema is evident at concentrations ranging from 10 μM to 40 μM. (b) The histogram displays cardiac area/total body area values, as an estimate of pericardial edema formation. Values are normalized to those of untreated larvae (NT). (c) At 72 hpf, larvae treated with adriamycin (ADR) 20–40 μM demonstrate a reduction of body length. (d) Mortality is significantly higher than controls at adriamycin concentration of 40 μM. (e) Temporal course of pericardial edema after addition of mannitol (175 mM) to the medium. The cardiac area/total body area remains significantly elevated in ADR-treated animals as compared to control (NT) larvae. Results are expressed as mean ±SEM of three independent experiments (15 fish for each experiment). Asterisks indicate significant differences between adriamycin-exposed and control (NT) animals: * = P<0.01; ** = P<0.005; *** = P<0.0001 vs NT. Scale bars = 1 mm. PHENOTYPE:
|

Temporal expression pattern of the podocyte markers nephrin (a) and wt1a/b (b) during early days of development and variation of expression after incubation with adriamycin (ADR) (c) (d). ** P<0.005 vs NT and *** P<0.0001 vs NT. Results are expressed as mean ±SEM of three independent experiments (10 fish per experiment). (e) At 72 hpf light microscopy of a treated fish does not show detectable damage. By transmission electron microscopy, impaired podocyte formation is evident in a treated (f) fish, with few and irregular podocyte processes. At the same time point, the untreated fish (g) shows regular distribution of processes along the glomerular basement membrane. Scale bars = 500 nm. PHENOTYPE:
|

Clearance of 70-kDa dextran in 80 hpf larvae. (a) a control larva immediately after dextran injection (0 hpi) shows distribution of fluorescence through the body, with major fluorescence in the heart and the eye. (b) representative images of untreated and treated fish at 24 hpi. Exposure to adriamycin causes dose-dependent loss of eye fluorescence, whereas the marker is retained in the cardiac area, due to pericardial edema. The graphs show quantification data of fluorescence intensity (obtained from 30 fish per condition and time point) in the pericardial area (c) and the eye (d). *** = P<0.0001 vs NT. |
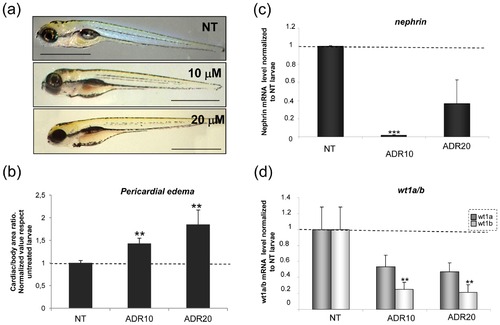
Analysis of adriamycin effects after removal from the medium. (a) At 120 hpf, treated larvae are characterized by persistence and worsening of pericardial edema. (b) The histogram displays values of cardiac area/total body area. (c) QRT-PCR analysis of podocyte markers. ** = P<0.005; *** = P<0.0001 vs NT. PHENOTYPE:
|
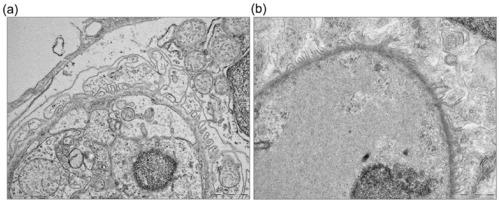
Ultrastructural analysis of glomeruli at 120 hpf. In NT fish the structure appears mature (a) while in adriamycin-treated fish there is almost complete disappearance of podocyte foot processes (b). Scale bars = 1 μm. PHENOTYPE:
|
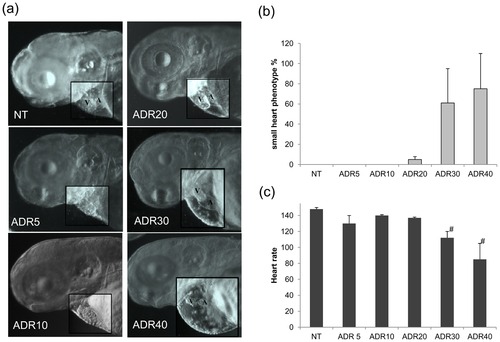
Heart morphology and functionality. (a) Morphological exam of the heart in the whole animal shows evident reduction of size and alteration of shape with adriamycin concentrations of 30 and 40 μM. (b) The graph shows the percentage of animals displaying heart changes. The high standard error proves the variability of the effect. (c) The heart rate shows a decrement in fish treated with 30–40 μM. # P<0.05 vs NT. A = atrium V = ventricle. Each data point is based on 30 embryos. PHENOTYPE:
|

Subintestinal vessels. The Figureure shows subintestinal vessels (SIVs) observed at 72 hpf. Altered vessels are present in larvae treated with 30 and 40 μM of adriamycin. PHENOTYPE:
|

Cartilage development. At 72(a), the craniofacial cartilage, detected by alcian blue staining, shows a delay of development (arrows) in fish exposed to 10–40 μM adriamycin. (b) At 120 hpf, larvae exposed to adriamycin up to 30 μM are indistinguishable from the control in terms of craniofacial morphology. Instead, exposure to adriamycin 40 μM causes persistent alteration of the cartilage structure. FITC-phalloidin staining shows normal muscle morphology of 72 hpf (c) and 120 hpf (d) larvae exposed to 20 μM adriamycin. PHENOTYPE:
|