
|
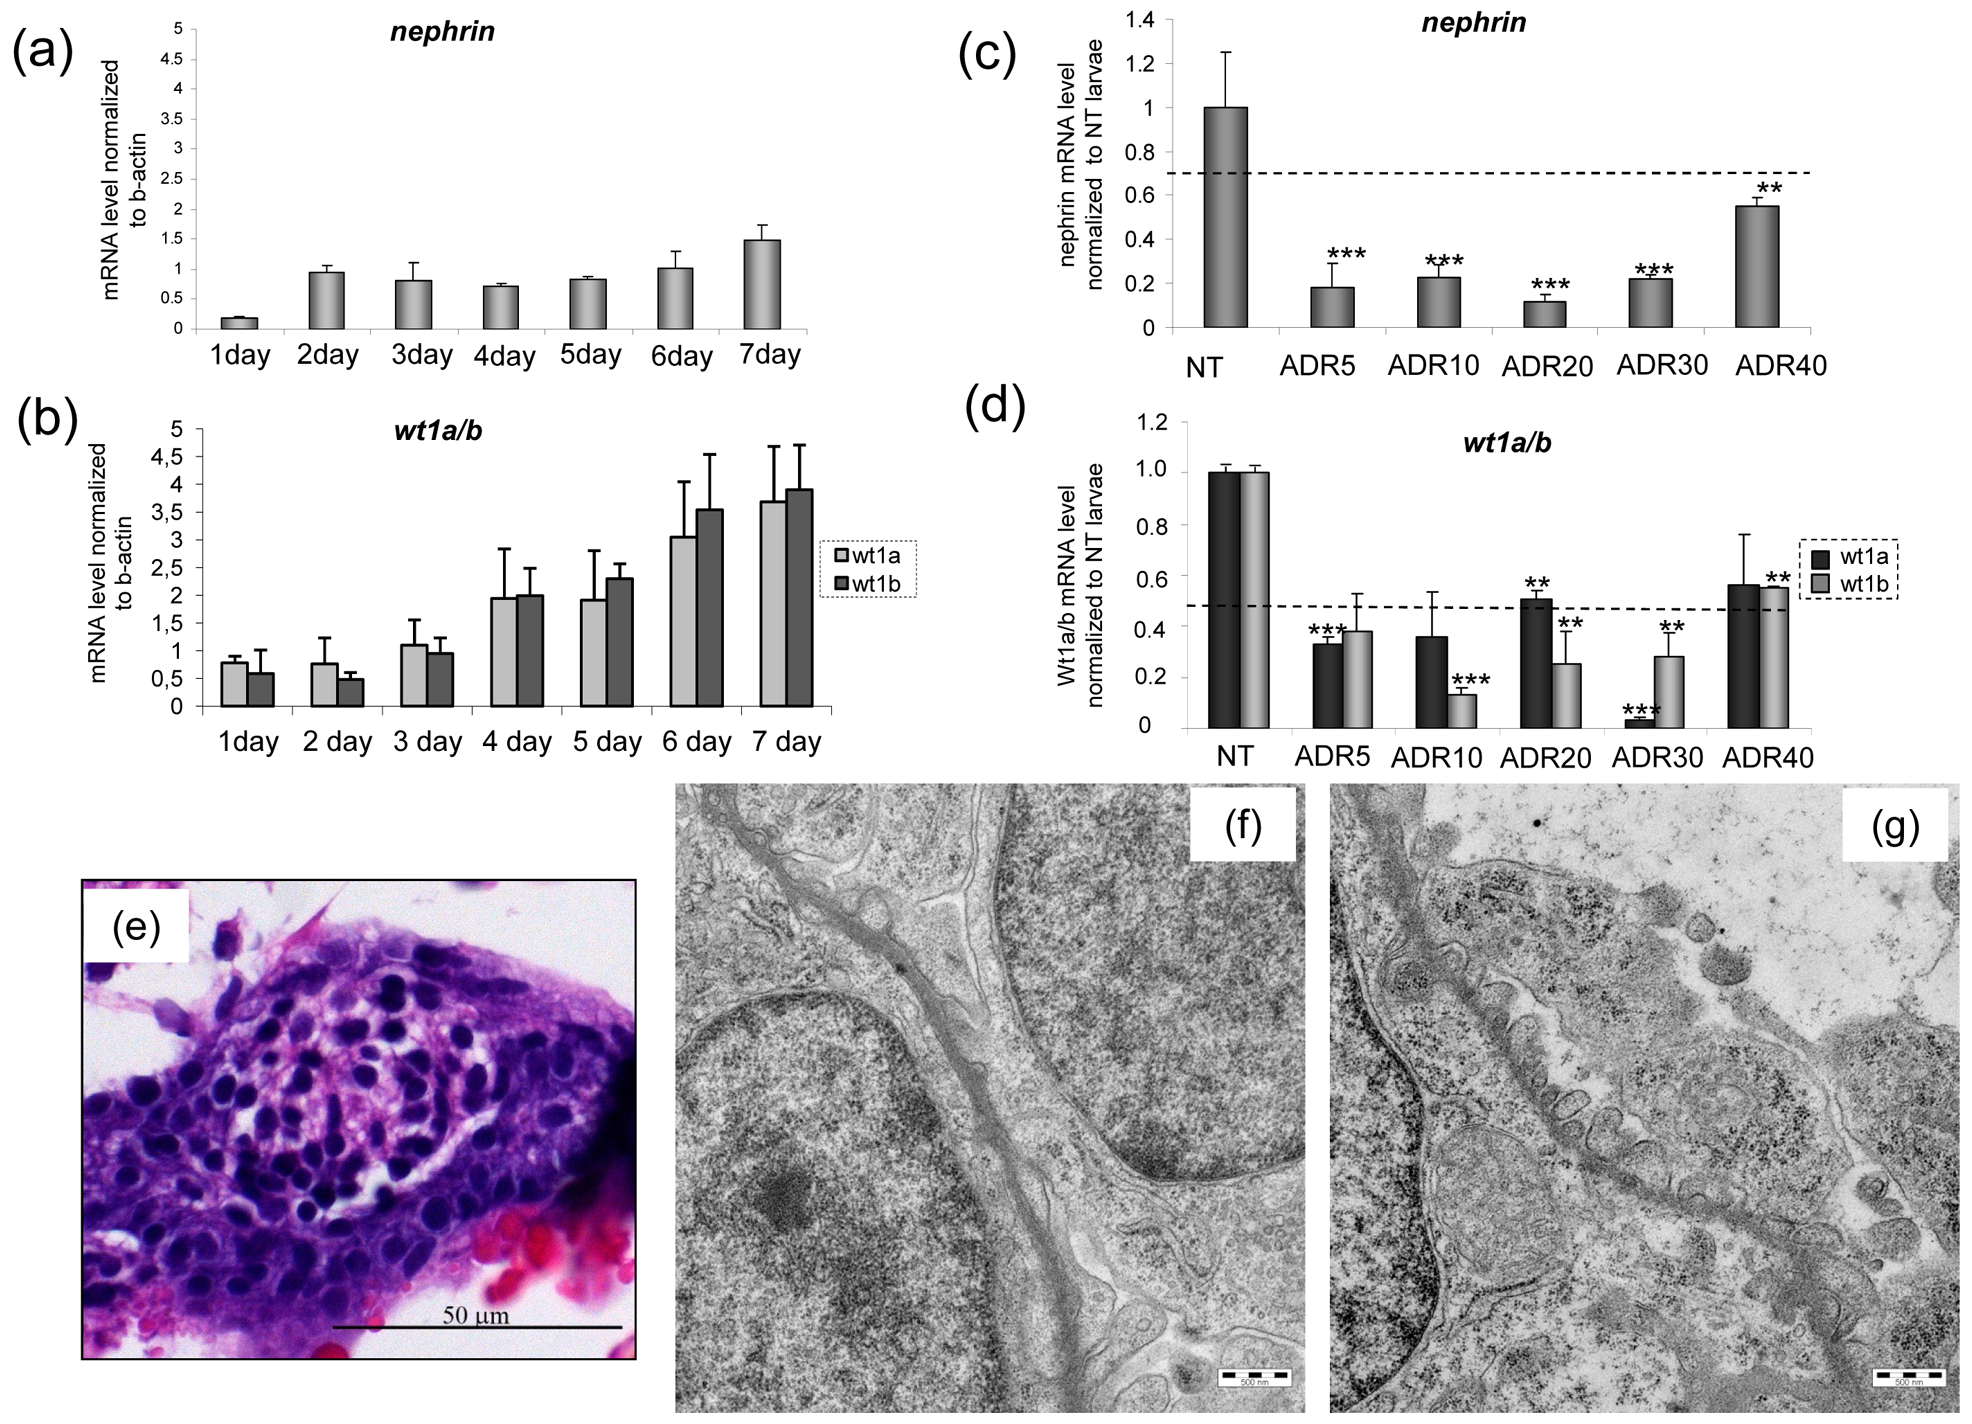
Fig. 3
Temporal expression pattern of the podocyte markers nephrin (a) and wt1a/b (b) during early days of development and variation of expression after incubation with adriamycin (ADR) (c) (d).
** P<0.005 vs NT and *** P<0.0001 vs NT. Results are expressed as mean ±SEM of three independent experiments (10 fish per experiment). (e) At 72 hpf light microscopy of a treated fish does not show detectable damage. By transmission electron microscopy, impaired podocyte formation is evident in a treated (f) fish, with few and irregular podocyte processes. At the same time point, the untreated fish (g) shows regular distribution of processes along the glomerular basement membrane. Scale bars = 500 nm.