
- Title
-
Role of histone deacetylase activity in the developing lateral line neuromast of zebrafish larvae
- Authors
- He, Y., Mei, H., Yu, H., Sun, S., Ni, W., Li, H.
- Source
- Full text @ Exp. Mol. Med.

Detection of neuromast HCs in 5dpf larvae. (a) Confocal images of neuromasts from a 5dpf control larva and 5dpf larvae treated with 0.1μM TSA, 100μM VPA or 10μM MS-275. The number of neuromast HCs was assessed by GFP visualization in the transgenic line Tg(Brn3c:mGFP). There is a significant decrease in HC number in the larvae treated with HDAC inhibitors. HCs are green and nuclei stained with DAPI are blue. Scale bar=10μm. (b) The average number of HCs per neuromast (NM) in 5dpf zebrafish larvae. The number of GFP-positive cells decreased in larvae treated with HDAC inhibitors. The HCs of the first four neuromasts along the body, L1 to L4, were recorded on one side of each fish. Bars are mean±s.e.m. and n=total number of neuromasts. P<0.05. (c) The zebrafish larvae treated with 0.1μM TSA, 100μM VPA or 10μM MS-275 from 3dpf to 5dpf and control larvae were morphologically normal. (d) Superimposition of a fluorescent image of a 5dpf zebrafish larva with neuromast HCs labeled with GFP. White arrows point to primary neuromasts L1 to L8 on the left side of the larva and the image shows secondary neuromasts (*) and a few neuromasts from the right side of the larva (not labeled). |

Detection of neuromast hair cells with live staining (FM1-43FX) in 5dpf larvae. (a) Confocal images of neuromasts from a control and 0.1μM TSA-treated larva at 5dpf that have been labeled for FM1-43FX to detect functional HCs. Fewer FM1-43FX-positive cells developed in the TSA-treated larva compared with the untreated control. Nuclei are stained with DAPI and scale bars=10μm. (b) The average number of functional HCs per neuromast (NM) in 5dpf zebrafish larvae following TSA treatment. **P<0.001. |

Detection of SCs with Sox2 in 5dpf larvae. (a) Confocal images of neuromasts from a control larva and larvae treated with 0.1μM TSA, 100μM VPA or 10μM MS-275 at 5dpf that have been labeled by Sox2 to detect SCs. Fewer Sox2-positive cells develop in the neuromasts of larvae treated with HDAC inhibitors. HCs are stained with myosin VI (blue), and red spots represent the Sox2 signal. Scale bars=10μm. (b) The average number of SCs per neuromast (NM) in 5dpf zebrafish larvae. The number of Sox2- positive cells decreased in larvae treated with HDAC inhibitors. The SCs of the first four neuromasts along the body, L1 to L4, were recorded on one side of each fish. Bars are mean±s.e.m. and n=total number of neuromasts. **P<0.001. |

The effect of HDAC inhibitors on the levels of histone acetylation. (a) Western blot analysis of protein extracts from 5dpf control larvae and larvae treated with HDAC inhibitors for 2 days starting at 3dpf. HDAC inhibitors induced the accumulation of acetylated (Ace) H3 and H4. Histones H3 and H4 were included as controls. (b) Confocal images of neuromasts from a 5dpf control larva and from 5dpf larvae treated with TSA, VPA or MS-275. Larvae were treated with 0.1μM TSA, 100μM VPA or 10μM MS-275 for 2 days starting at 3dpf and were stained (red) by antibodies against Ace histone H3 and Ace histone H4. The levels of Ace histone H3 and Ace histone H4 are increased in the presence of HDAC inhibitors compared with the controls (CON). HCs were labeled with antibodies against Myosin VI (green) and nuclei were stained with DAPI (blue). Scale bar=10μm. |

HDAC inhibitors inhibit neuromast cell proliferation. (a) Confocal images of neuromasts from a 5dpf control and from 5dpf embryos treated with 0.1μM TSA, 100μM VPA or 10μM MS-275 that have been labeled by BrdU to detect proliferating cells. The number of BrdU-labeled cells is much larger in control than in HDAC inhibitor-treated embryos. Red spots represent BrdU signal. HCs are labeled with an antibody against myosin VI (green). Scale bar=10μm. (b) Quantification of replicating cells in the neuromasts for each experimental condition. The BrdU index is higher in the control relative to the HDAC inhibitor-treated fish. The proliferating cells of the first four neuromasts along the body, L1 to L4, were recorded on one side of each fish. Bars are mean±s.e.m. and n=36 neuromasts per condition. **P<0.001. (c) Confocal images of neuromasts from a 5dpf control and from 5dpf embryos treated with 0.1μM TSA, 100μM VPA or 10μM MS-275. HDAC inhibitor treatment decreased the numbers of both BrdU-positive HCs and BrdU-positive SCs in neuromasts. White arrows indicate HCs that were derived from proliferating SCs. Scale bar=10μm. (d, e) Quantification of replicating cells co-labeled with Myosin VI or Sox2 per neuromast (NM) in control and HDAC inhibitor-treated larvae. Bars are mean±s.e.m. and n=36 neuromasts per condition. **P<0.001. (f) Real-time RT–PCR analysis showed that TSA treatment increases the mRNA expression of p21, p27 and p53. The bars represent the means±s.d. of the ratios of p21, p27 and p53 to GAPDH in the real-time RT–PCR data. *P<0.05. |
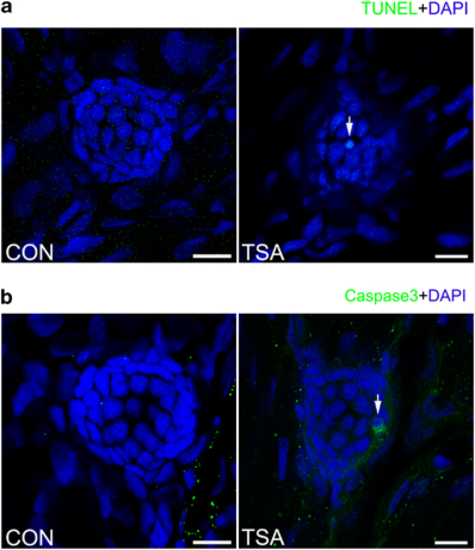
A high concentration of TSA (0.2μM) results in apoptotic cells within the lateral line neuromast. (a) TUNEL staining in the neuromast from a control and TSA-treated larva at 5dpf. White arrows indicate TUNEL-positive cells. (b) Cleaved caspase-3 staining in the neuromast from a control and TSA-treated larva. White arrows indicate cells with cleaved caspase-3. Scale bar=10μm. |
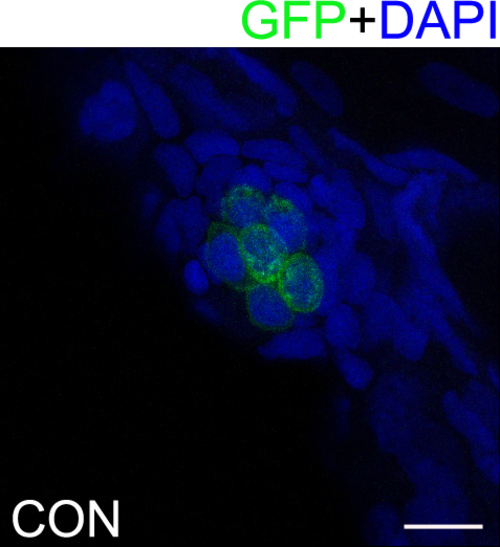
Neuromast HC detection in 3 dpf larvae. Confocal images of neuromasts from a 3 dpf transgenic line Tg(Brn3c:mGFP) larva. |

(a) Co-localization of FM1-43FX with GFP in the neuromast from control and 0.1 μM TSA-treated larvae. Immunofluorescence showing FM1-43FX (red) in GFP transgenic embryos (green) at 5 dpf. (b) Comparison of the GFP-labeled HCs, FM1-43FX stained HCs, and the percentage of GFP-labeled HCs that are co-labeled with FM1-43FX in control and TSA-treated larvae. Bars are mean ± SEM and n = 25 neuromasts per condition. |

Immunoblotting analyses of the expression of acetylated histones H3 (Ace H3) and acetylated histones H4 (Ace H4). (a, b) Co-localization of Ace H3 and Ace H4 protein with Sox2 in the neuromast from a 5 dpf control larva and from 5 dpf larvae treated with TSA, VPA or MS-275. Larvae were treated with 0.1 μM TSA, 100 μM VPA, or 10 μM MS-275 for 2 days starting at 3 dpf and were stained (green) by antibodies against Ace histone H3 and Ace histone H4. SCs were labeled with antibodies against Sox2 (red). Ace H3/H4 expression can be seen in the SCs. The levels of Ace H3/H4 are increased in the presence of HDAC inhibitors compared to the controls. Scale bar = 10 μm. |