
|
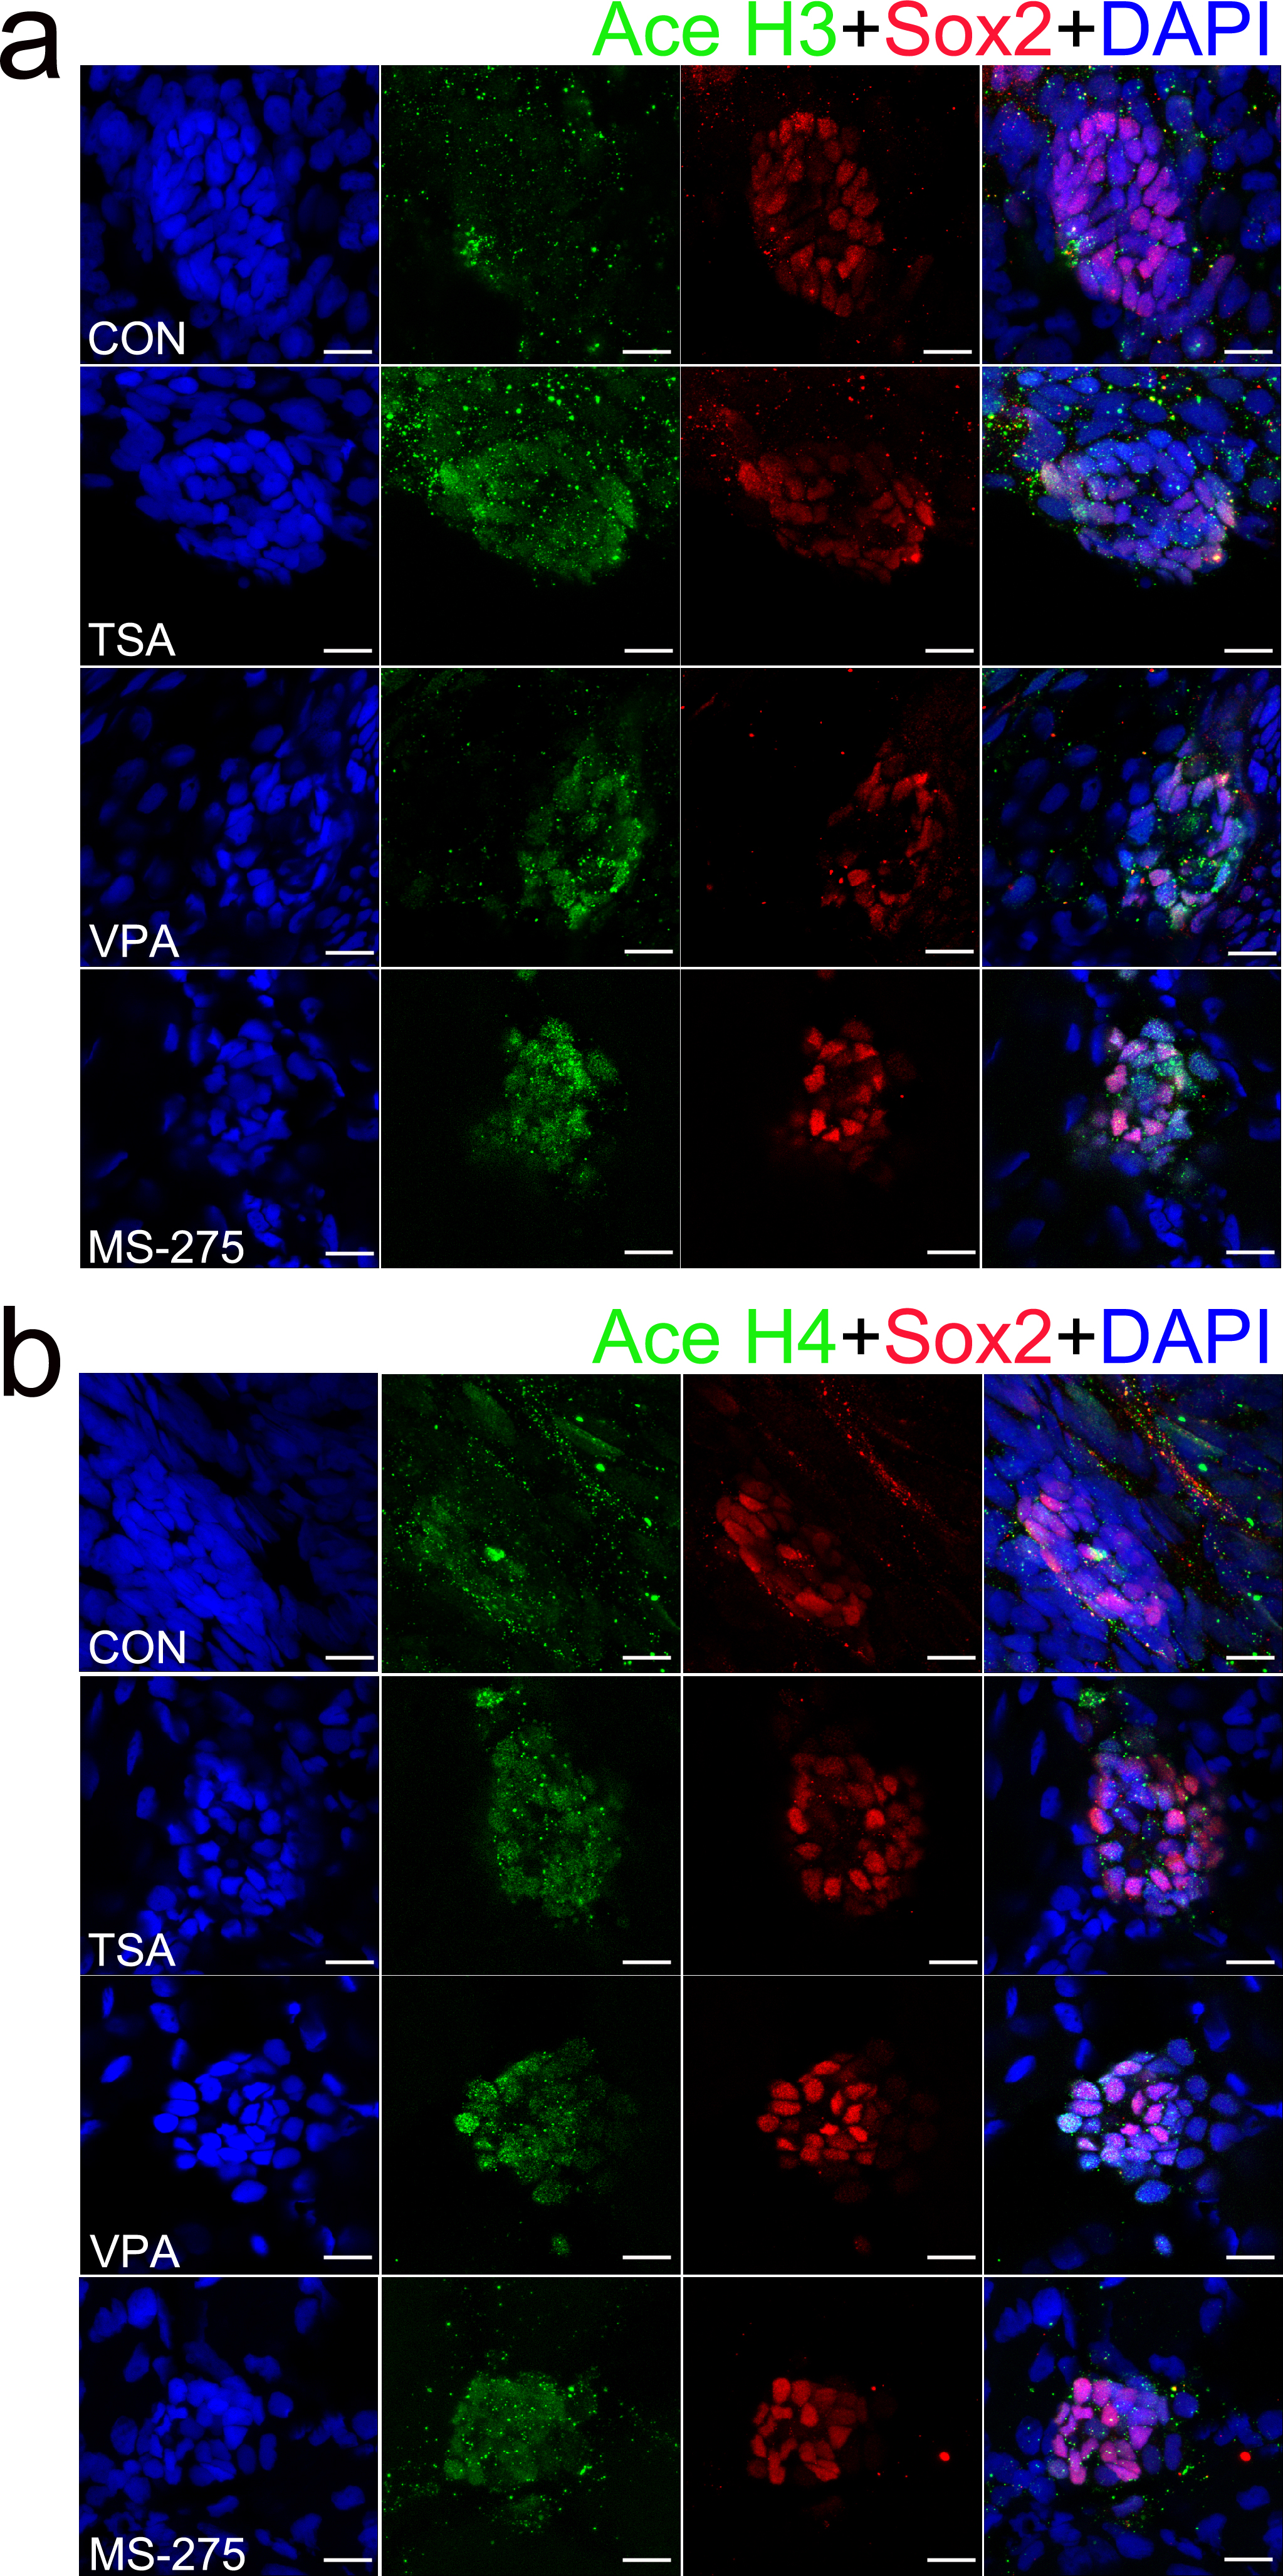
Fig. S3
Immunoblotting analyses of the expression of acetylated histones H3 (Ace H3) and acetylated histones H4 (Ace H4). (a, b) Co-localization of Ace H3 and Ace H4 protein with Sox2 in the neuromast from a 5 dpf control larva and from 5 dpf larvae treated with TSA, VPA or MS-275. Larvae were treated with 0.1 μM TSA, 100 μM VPA, or 10 μM MS-275 for 2 days starting at 3 dpf and were stained (green) by antibodies against Ace histone H3 and Ace histone H4. SCs were labeled with antibodies against Sox2 (red). Ace H3/H4 expression can be seen in the SCs. The levels of Ace H3/H4 are increased in the presence of HDAC inhibitors compared to the controls. Scale bar = 10 μm.