
Image
|
Figure Caption
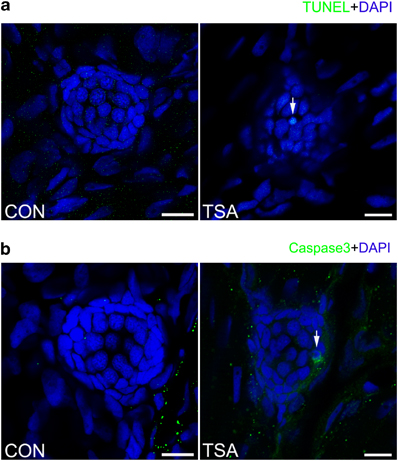
Fig. 6
A high concentration of TSA (0.2μM) results in apoptotic cells within the lateral line neuromast. (a) TUNEL staining in the neuromast from a control and TSA-treated larva at 5dpf. White arrows indicate TUNEL-positive cells. (b) Cleaved caspase-3 staining in the neuromast from a control and TSA-treated larva. White arrows indicate cells with cleaved caspase-3. Scale bar=10μm.
Acknowledgments
This image is the copyrighted work of the attributed author or publisher, and
ZFIN has permission only to display this image to its users.
Additional permissions should be obtained from the applicable author or publisher of the image.
Full text @ Exp. Mol. Med.