
|
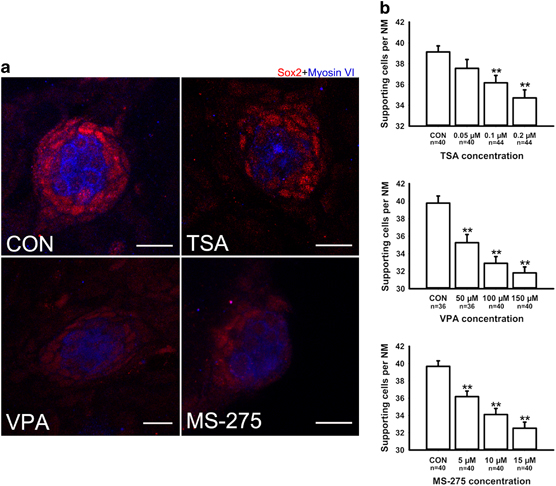
Fig. 3
Detection of SCs with Sox2 in 5dpf larvae. (a) Confocal images of neuromasts from a control larva and larvae treated with 0.1μM TSA, 100μM VPA or 10μM MS-275 at 5dpf that have been labeled by Sox2 to detect SCs. Fewer Sox2-positive cells develop in the neuromasts of larvae treated with HDAC inhibitors. HCs are stained with myosin VI (blue), and red spots represent the Sox2 signal. Scale bars=10μm. (b) The average number of SCs per neuromast (NM) in 5dpf zebrafish larvae. The number of Sox2- positive cells decreased in larvae treated with HDAC inhibitors. The SCs of the first four neuromasts along the body, L1 to L4, were recorded on one side of each fish. Bars are mean±s.e.m. and n=total number of neuromasts. **P<0.001.