
- Title
-
Transcript processing and export kinetics are rate-limiting steps in expressing vertebrate segmentation clock genes
- Authors
- Hoyle, N.P., and Ish-Horowicz, D.
- Source
- Full text @ Proc. Natl. Acad. Sci. USA
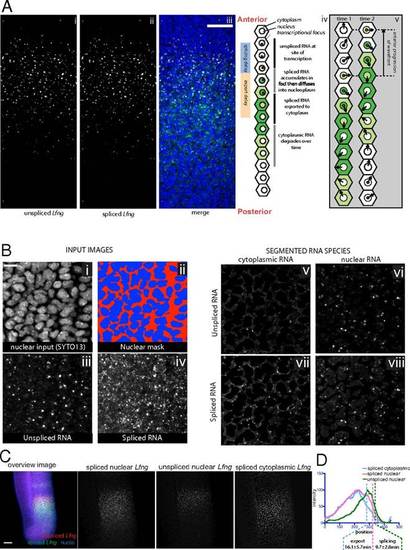
In vivo Lfng transcript delays measured by multilabeled FISH. (A) FISH detection of unspliced Lfng (i) and spliced Lfng (ii) in E10.5 mouse PSM, with merge (iii). Nuclei are stained using SYTO13. In this and subsequent figures, anterior is upward. (Scale bar, 500 µm.) (iv) Due to slowing of the clock as cells mature, anterior cells are in an earlier phase (as shown by arrow direction in v) of the gene expression cycle than posterior cells. (v) Local synchrony leads to kinematic anterior progression of the expression domain. Red and yellow nuclear dots show sites of nascent unspliced and spliced nuclear transcripts, and shades of green represent levels of spliced transcript. (B) Segmentation of multicolor FISH images. The nuclear channel (i) was manually thresholded to a binary image (red and blue) (ii), and used with stacked images of unspliced (iii) and spliced (iv) RNA to generate images of the unspliced cytoplasmic (v), unspliced nuclear (vi), spliced cytoplasmic (vii), and spliced nuclear (viii) signals. Scale bar: 10 mm. (C) Z-average projections of multicolor Lfng FISH z-stacks generated after segmentation. (Scale bar: 100 µm unless otherwise defined.) (D) Lfng signal intensity plots of images in C measured from the posterior to anterior of the expression domain and averaged across the width of the PSM. The anterior inflection points of the various expression domains used to measure the mean splicing and export offset times are marked with vertical dashed lines show (also in subsequent graphs). |
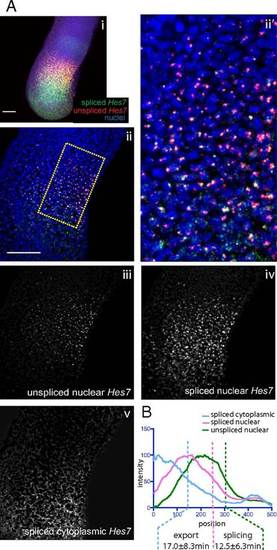
Estimation of transcript export and splicing delays of Hes7 in the mouse PSM. (A, i) Maximum z-projection of FISH against Mouse Hes7. Segmentation of higher magnification FISH images was conducted as in Fig. 2B. An example source image (ii) and detailed view of the source image indicated by the hatched area (ii2) are shown, along with the segmented images representing unspliced nuclear pre-mRNA (iii), spliced nuclear mRNA (iv), and spliced cytoplasmic mRNA (v). Average z-projections are shown. (Scale bar: 100 µm.) (B) Intensity plots of images in A, iii–v measured from the posterior to anterior of the expression domain, averaged across the width of the PSM. |
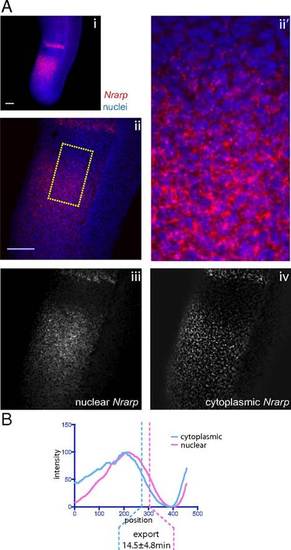
Estimation of transcript export delays of Nrarp in the mouse PSM. (A, i) Maximum z-projection of FISH against Mouse Nrarp. Segmentation of higher magnification FISH images was conducted as in Fig. 2B. An example source image (ii) and detailed view of the source image indicated by the hatched area (ii2) are shown, along with the segmented images representing unspliced nuclear pre-mRNA (iii), spliced nuclear mRNA (iv), and spliced cytoplasmic mRNA (v). Average z-projections are shown. (B) Intensity plots of images in A, iii–v measured from the posterior to anterior of the expression domain, averaged across the width of the PSM. |
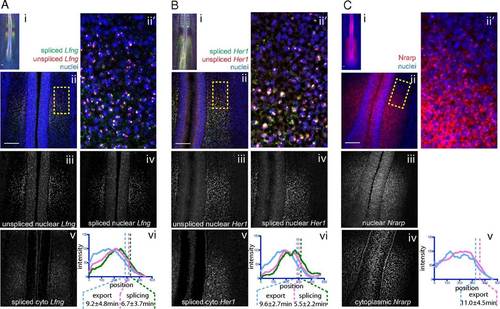
mRNA export and splicing delays measured in the chick PSM. Maximum z-projection of FISH for chick Lfng (A), Hairy1/Her1 (B), and Nrarp (C) shows (i) embryo posteriors. Higher magnification images (ii) were segmented as in Fig. 2B to generate images of unspliced nuclear RNA (iii), spliced nuclear RNA (iv), and spliced cytoplasmic RNA (v). Anteroposterior intensity profile graphs of one PSM are shown for each RNA species. Anterior inflection points are shown, along with average export and splicing offsets from Table 1. Maximum z-projection of FISH against chick Lfng (A), Hairy1/Her1 (B), and Nrarp (C) shows representative embryos at low (i) and higher (ii and ii2) magnification. Sets iii–v are as labeled, except that A, vi; B, vi; and C, v show the intensity graphs from which measurements were drawn. |
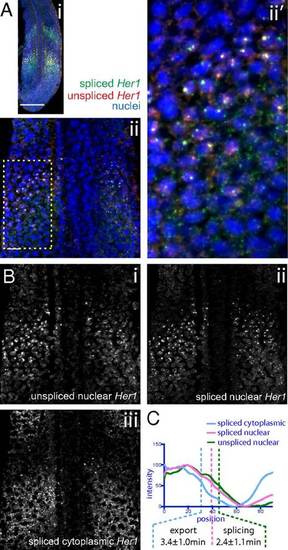
Estimation of mRNA export and splicing delays in the zebrafish PSM. (A) Maximum z-projection of FISH against zebrafish Her1. (B) Segmentation of higher magnification FISH against Her1 shows the source image (i), unspliced nuclear pre-mRNA (ii), spliced nuclear mRNA (iii), and spliced cytoplasmic mRNA (iv). (C) Intensity plots of images in B measured from the posterior to anterior of the expression domain, averaged across the width of the PSM, and corrected for skew (Materials and Methods). Anterior inflection points of the posterior expression domain are indicated with dashed lines for each RNA species. |