
Fig. 5
- ID
- ZDB-FIG-150428-15
- Publication
- Hoyle et al., 2013 - Transcript processing and export kinetics are rate-limiting steps in expressing vertebrate segmentation clock genes
- Other Figures
- All Figure Page
- Back to All Figure Page
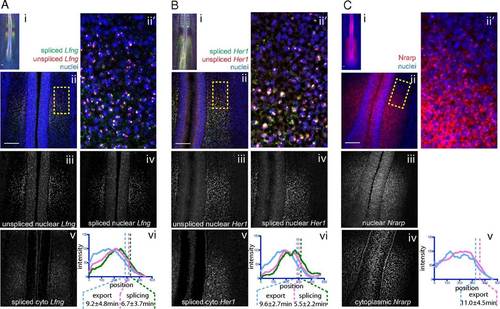
mRNA export and splicing delays measured in the chick PSM. Maximum z-projection of FISH for chick Lfng (A), Hairy1/Her1 (B), and Nrarp (C) shows (i) embryo posteriors. Higher magnification images (ii) were segmented as in Fig. 2B to generate images of unspliced nuclear RNA (iii), spliced nuclear RNA (iv), and spliced cytoplasmic RNA (v). Anteroposterior intensity profile graphs of one PSM are shown for each RNA species. Anterior inflection points are shown, along with average export and splicing offsets from Table 1. Maximum z-projection of FISH against chick Lfng (A), Hairy1/Her1 (B), and Nrarp (C) shows representative embryos at low (i) and higher (ii and ii2) magnification. Sets iii–v are as labeled, except that A, vi; B, vi; and C, v show the intensity graphs from which measurements were drawn. |