
|
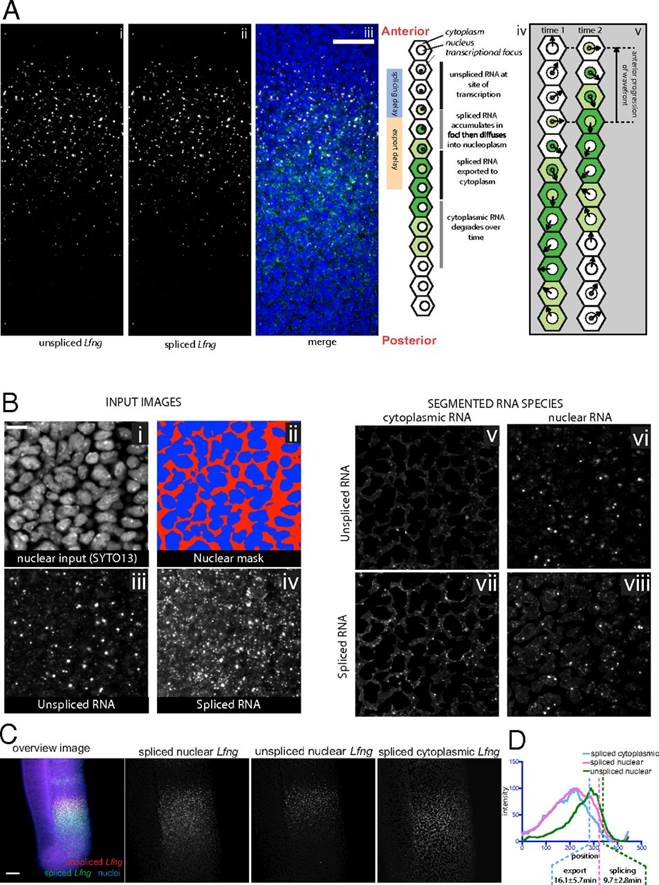
Fig. 2
In vivo Lfng transcript delays measured by multilabeled FISH. (A) FISH detection of unspliced Lfng (i) and spliced Lfng (ii) in E10.5 mouse PSM, with merge (iii). Nuclei are stained using SYTO13. In this and subsequent figures, anterior is upward. (Scale bar, 500 µm.) (iv) Due to slowing of the clock as cells mature, anterior cells are in an earlier phase (as shown by arrow direction in v) of the gene expression cycle than posterior cells. (v) Local synchrony leads to kinematic anterior progression of the expression domain. Red and yellow nuclear dots show sites of nascent unspliced and spliced nuclear transcripts, and shades of green represent levels of spliced transcript. (B) Segmentation of multicolor FISH images. The nuclear channel (i) was manually thresholded to a binary image (red and blue) (ii), and used with stacked images of unspliced (iii) and spliced (iv) RNA to generate images of the unspliced cytoplasmic (v), unspliced nuclear (vi), spliced cytoplasmic (vii), and spliced nuclear (viii) signals. Scale bar: 10 mm. (C) Z-average projections of multicolor Lfng FISH z-stacks generated after segmentation. (Scale bar: 100 µm unless otherwise defined.) (D) Lfng signal intensity plots of images in C measured from the posterior to anterior of the expression domain and averaged across the width of the PSM. The anterior inflection points of the various expression domains used to measure the mean splicing and export offset times are marked with vertical dashed lines show (also in subsequent graphs).