
Fig. 3
- ID
- ZDB-FIG-150428-13
- Publication
- Hoyle et al., 2013 - Transcript processing and export kinetics are rate-limiting steps in expressing vertebrate segmentation clock genes
- Other Figures
- All Figure Page
- Back to All Figure Page
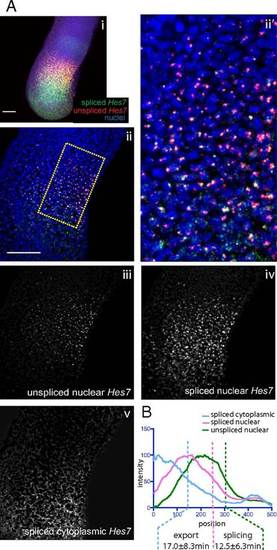
Estimation of transcript export and splicing delays of Hes7 in the mouse PSM. (A, i) Maximum z-projection of FISH against Mouse Hes7. Segmentation of higher magnification FISH images was conducted as in Fig. 2B. An example source image (ii) and detailed view of the source image indicated by the hatched area (ii2) are shown, along with the segmented images representing unspliced nuclear pre-mRNA (iii), spliced nuclear mRNA (iv), and spliced cytoplasmic mRNA (v). Average z-projections are shown. (Scale bar: 100 µm.) (B) Intensity plots of images in A, iii–v measured from the posterior to anterior of the expression domain, averaged across the width of the PSM. |