
|
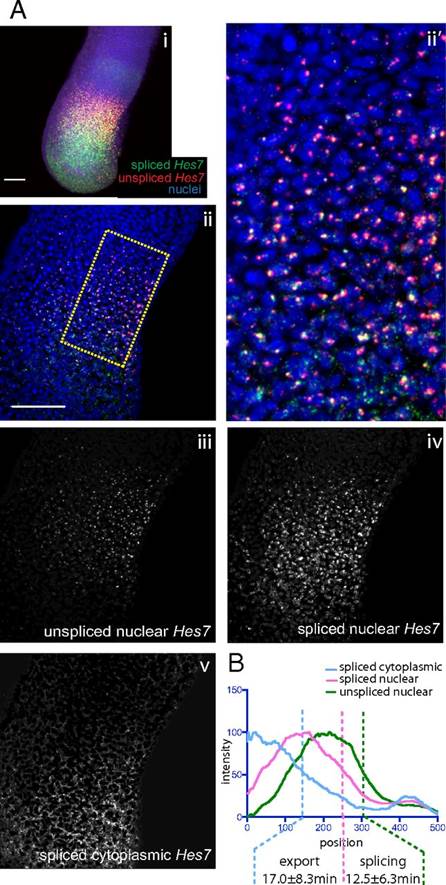
Fig. 3
Estimation of transcript export and splicing delays of Hes7 in the mouse PSM. (A, i) Maximum z-projection of FISH against Mouse Hes7. Segmentation of higher magnification FISH images was conducted as in Fig. 2B. An example source image (ii) and detailed view of the source image indicated by the hatched area (ii2) are shown, along with the segmented images representing unspliced nuclear pre-mRNA (iii), spliced nuclear mRNA (iv), and spliced cytoplasmic mRNA (v). Average z-projections are shown. (Scale bar: 100 µm.) (B) Intensity plots of images in A, iii–v measured from the posterior to anterior of the expression domain, averaged across the width of the PSM.