
FIGURE
Fig. 6
- ID
- ZDB-FIG-150428-16
- Publication
- Hoyle et al., 2013 - Transcript processing and export kinetics are rate-limiting steps in expressing vertebrate segmentation clock genes
- Other Figures
- All Figure Page
- Back to All Figure Page
Fig. 6
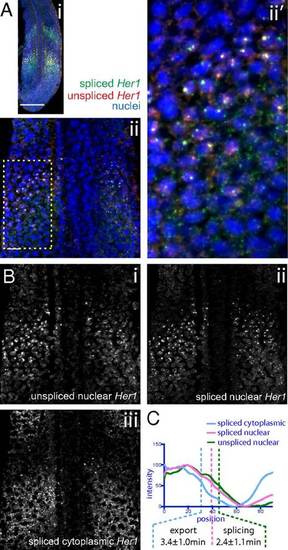
Estimation of mRNA export and splicing delays in the zebrafish PSM. (A) Maximum z-projection of FISH against zebrafish Her1. (B) Segmentation of higher magnification FISH against Her1 shows the source image (i), unspliced nuclear pre-mRNA (ii), spliced nuclear mRNA (iii), and spliced cytoplasmic mRNA (iv). (C) Intensity plots of images in B measured from the posterior to anterior of the expression domain, averaged across the width of the PSM, and corrected for skew (Materials and Methods). Anterior inflection points of the posterior expression domain are indicated with dashed lines for each RNA species. |
Expression Data
Expression Detail
Antibody Labeling
Phenotype Data
Phenotype Detail
Acknowledgments
This image is the copyrighted work of the attributed author or publisher, and
ZFIN has permission only to display this image to its users.
Additional permissions should be obtained from the applicable author or publisher of the image.
Full text @ Proc. Natl. Acad. Sci. USA