- Title
-
The African coelacanth genome provides insights into tetrapod evolution
- Authors
- Amemiya, C.T., Alfoldi, J., Lee, A.P., Fan, S., Philippe, H., MacCallum, I., Braasch, I., Manousaki, T., Schneider, I., Rohner, N., Organ, C., Chalopin, D., Smith, J.J., Robinson, M., Dorrington, R.A., Gerdol, M., Aken, B., Biscotti, M.A., Barucca, M., Baurain, D., Berlin, A.M., Blatch, G.L., Buonocore, F., Burmester, T., Campbell, M.S., Canapa, A., Cannon, J.P., Christoffels, A., de Moro, G., Edkins, A.L., Fan, L., Fausto, A.M., Feiner, N., Forconi, M., Gamieldien, J., Gnerre, S., Gnirke, A., Goldstone, J.V., Haerty, W., Hahn, M.E., Hesse, U., Hoffmann, S., Johnson, J., Karchner, S.I., Karaku, S., Lara, M., Levin, J.Z., Litman, G.W., Mauceli, E., Miyake, T., Mueller, M.G., Nelson, D.R., Nitsche, A., Olmo, E., Ota, T., Pallavicini, A., Panji, S., Picone, B., Ponting, C.P., Prohaska, S.J., Przybylski, D., Saha, N.R., Ravi, V., Ribeiro, F.J., Sauka-Spengler, T., Scapigliati, G., Searle, S.M.J., Sharpe, T., Simakov, O., Stadler, P.F., Stegeman, J.J., Sumiyama, K., Tabbaa, D., Tafer, H., Turner-Maier, J., van Heusden, P., White, S., Williams, L., Yandell, M., Brinkmann, H., Volff, J.N., Tabin, C.J., Shubin, N., Schartl, M., Jaffe, D.B., Postlethwait, J.H., Venkatesh, B., Palma, F.D., Lander, E.S., Meyer, A., and Lindblad-Toh, K.
- Source
- Full text @ Nature
|
Multiple sequence alignments of 251 genes with a 1:1 ratio of orthologues in 22 vertebrates and with a full sequence coverage for both lungfish and coelacanth were used to generate a concatenated matrix of 100,583 unambiguously aligned amino acid positions. The Bayesian tree was inferred using PhyloBayes under the CAT +GTR+ Γ4 model with confidence estimates derived from 100 gene jack-knife replicates (support is 100% for all clades but armadillo + elephant with 45%). The tree was rooted on cartilaginous fish, and shows that the lungfish is more closely related to tetrapods than the coelacanth, and that the protein sequence of coelacanth is evolving slowly. Pink lines (tetrapods) are slightly offset from purple lines (lobe-finned fish), to indicate that these species are both tetrapods and lobe-finned fish. |
|
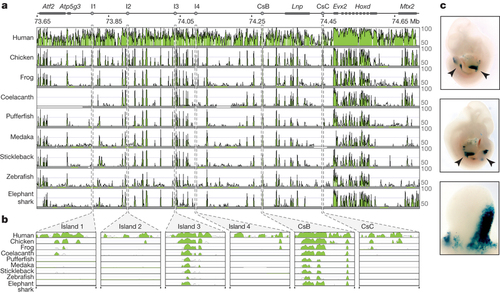
a, Organization of the mouse HOX-D locus and centromeric gene desert, flanked by the Atf2 and Mtx2 genes. Limb regulatory sequences (I1, I2, I3, I4, CsB and CsC) are noted. Using the mouse locus as a reference (NCBI and mouse genome sequencing consortium NCBI37/mm9 assembly), corresponding sequences from human, chicken, frog, coelacanth, pufferfish, medaka, stickleback, zebrafish and elephant shark were aligned. Alignment shows regions of homology between tetrapod, coelacanth and ray-finned fishes. b, Alignment of vertebrate cis-regulatory elements I1, I2, I3, I4, CsB and CsC. c, Expression patterns of coelacanth island I in a transgenic mouse. Limb buds are indicated by arrowheads in the first two panels. The third panel shows a close-up of a limb bud. |
|
Branch lengths are scaled to the expected number of substitutions per nucleotide, and branch colours indicate the strength of selection (dN/dS or ω). Red, positive or diversifying selection (ω>5); blue, purifying selection (ω = 0); yellow, neutral evolution (ω = 1). Thick branches indicate statistical support for evolution under episodic diversifying selection. The proportion of each colour represents the fraction of the sequence undergoing the corresponding class of selection. |
|
Phylogenetic tree inferred from the same phylogenomic dataset as in Figure 1 but using the worst fitting model LG+F+G4. In this maximum likelihood tree obtained with RAxML, the lungfish and the coelacanth form a clade that is sister to the tetrapods. Confidence estimates were derived from 100 bootstrap replicates and bullets denote nodes receiving maximum support. The scale bar indicates the number of substitutions per site. |
|
Identification of a gene lost in tetrapods, the Atonal homolog 1b (Atoh1b) gene. A) In EnsemblCompara GeneTree ENSGT00630000089619, two Atoh1 gene clades are apparent: Atoh1a, present in teleosts, Latimeria, and tetrapods, and Atoh1b, present in teleosts and Latimeria only. B) and C) Dotplots of zebrafish (Dre) vs. human (Hsa) chromosomes from the Synteny Database. B) The zebrafish atoh1b gene region on Dre14 shares conserved syntenies with human chromsomes Hsa4 (containing ATOH1A) and Hsa5 (no ATOH1 gene present). Zebrafish atoh1b is found on Dre8 (not shown). Human chromosomes Hsa4 and Hsa5 are derived from the ancestral vertebrate chromosome C. C) Orthologs of the genes flanking atoh1b, tspan17 and dok3, are found on Hsa5, which shows double conserved synteny with Dre14 (containing atoh1b) and Dre21, as result of the teleost genome duplication. The combination of phylogenetic (A) and syntenic (B, C) data provides evidence that an Atoh1 gene on the ancestral vertebrate chromosome C was duplicated in the course of the two rounds of vertebrate genome duplication. The Atoh1a paralog (ohnolog) was retained in all bony vertebrate lineages (ray-finned and lobe-finned fish, including tetrapods), while Atoh1b was lost in tetrapods from a region located on Hsa5 in the human genome. |
|
Evolution of the And1/2 – Otomp – Acvrl1 region in bony vertebrates. Orthologs of genes on coelacanth scaffolds JH126651.1 and JH127818.1 are distributed across chromosomes Hsa2 and Hsa3 in the human (e.g. M. Courtenay-Latimer) genome, indicating translocations on the tetrapod branch leading to human, while teleost (co-) orthologs of these Latimeria genes are distributed among two zebrafish chromsomes, Dre2 and Dre24, which contain paralogons from the teleost genome duplication (TGD). Note that gene order in human and zebrafish is presented according to the coelacanth gene order. The region contains several genes involved in fin (blue) and ear development (red), among them three genes lost in tetrapods: Zebrafish actinodin 1 (and1) and actinodin2 (and2) genes encode structural proteins of the actinotrichia, the skeletal elements that stiffen fin folds, and their loss in tetrapods has been suggested to have contributed to the fin-to-limb transition180. Loss of acvrl1, encoding a BMP receptor, leads in teleosts to the malformation of the ventral tail fin (lost-a-fin mutant)211-212. The otolith matrix protein (otomp) gene is essential for otolith formation in the zebrafish ear213, the tetrapod homolog of which evolved adaptations for signal detection in air. |
|
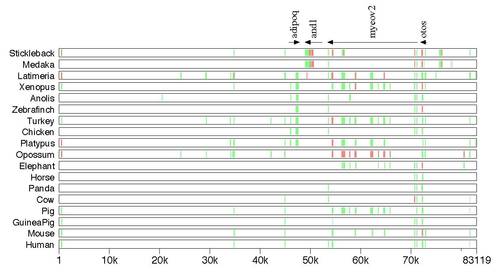
Actinodin alignments across vertebrates. a) A MultiPipMaker global alignment of zebrafish and1 (actinodin) syntenic regions (around 40k bases) among three fishes, zebrafish, Medaka and stickleback, and one amphibian Xenopus tropicalis. The comparison was made against the zebrafish sequence. All sequences were extracted from Ensembl genomic databases available at the Welcome Trust Sanger Institute, Genome Research Limited. In Xenopus, the comparable conserved elements to fish and1 were not observed in the sequence between adipoq and myeov2. adipoq: adiponectin; myeov2: myeloma overexpressed2; otos: otospiralin. The annotation of the zebrafish and1 was made using NCBI GenBank accession NM_00119725 and Zhang et al. (2010). MultiPipMaker: http://pipmaker.bx.psu.edu/pipmaker/ (Schwartz et al., 2000). Note that the teleost fish Atlantic cod (Gadus morhua) does have adipoq, and1, myeov2, and otos but their syntenic relationships are not yet determined (Ensembl genomic databases at the Welcome Trust Sanger Institute, Genome Research Limited, updated on January 17, 2012). b) A MultiPipMaker alignment of zebrafish and Latimeria chalumnae and1 (actinodin) syntenic regions among different vertebrate animals. The comparison was made against the zebrafish. The conserved and1 element was only found in medaka, stickleback and L. chalumnae when the zebrafish and1 syntenic region was compared against the regions of the other vertebrates. adipoq: adiponectin; myeov2: myeloma overexpressed2; otos: otospiralin. |
|
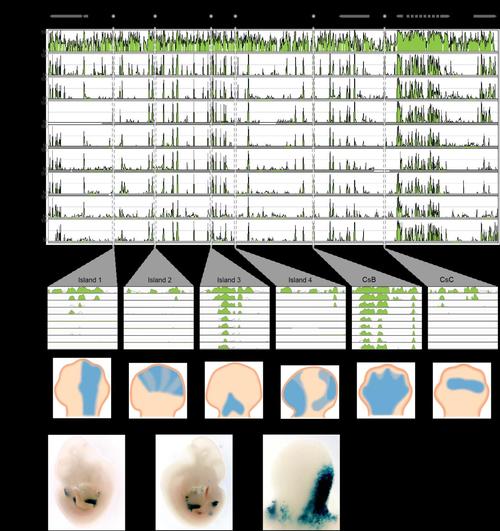
Alignment of the HoxD locus and upstream gene desert identifies conserved limb enhancers. (a) Organization of the mouse HoxD locus and centromeric gene desert, flanked by the ATF2 and MTX2 genes. Limb regulatory sequences (I1, I2, I3, I4, CsB and CsC) are noted. Using the mouse locus as a reference (NCBI37/mm9 assembly), corresponding sequences from human, chicken, frog, coelacanth, pufferfish, medaka, stickleback, zebrafish and elephant shark were aligned. Alignment (mVISTA program, homology threshold 70%) shows regions of homology between tetrapod, coelacanth and ray-finned fishes. (b) Alignment of vertebrate cis-regulatory elements I1, I2, I3, I4, CsB and CsC. (c) Expression patterns driven by each regulatory element assayed via mouse transgenesis. (d) Expression patterns of coelacanth Island I in a transgenic mouse. Limb buds indicated by arrowheads in the first two panels. The third panel shows a close-up of a limb bud. |
|
Schematic representation of the hepatic urea cycle. In the mitochondrion the toxic ammonium (NH4+) is coupled with carbondioxide (CO2)and phosphate from ATP to produce carbamoyl phosphate. This is the rate limiting step of the cycle and is catalyzed by the enzyme carbamoyl phosphate synthase 1 (CPS1). The carbamoylphosphate is then transferred to ornithine by ornithine-carbamoylphosphate transferase, leaves the mitochondrion and is further metabolised in two steps by argininosuccinate synthase 1 (ASS1) and argininosuccinatelyse (ASL) to finally generate the aminoacid arginine. By arginase 2 (ARG2) urea is released and ornithine is recovered, which then enters the mitochondrion to initiate a new round of the cycle. |
|
Test for episodic positive selection on ARG2 coding sequences. Branch lengths are scaled to the expected number of substitutions/nucleotide and Branch colour indicates the type of selection (dN/dS or ω) with red corresponding to positive or diversifying selection (ω > 5), blue to purifying selection (ω = 0), and grey to neutral evolution (ω = 1). The proportion of each colour on a branch represents the fraction of the sequence undergoing the corresponding class of selection. Thick branches would indicate statistical support for positive selection. Note that there is no evidence for selection in ARG2 within the vertebrate tree. |
|
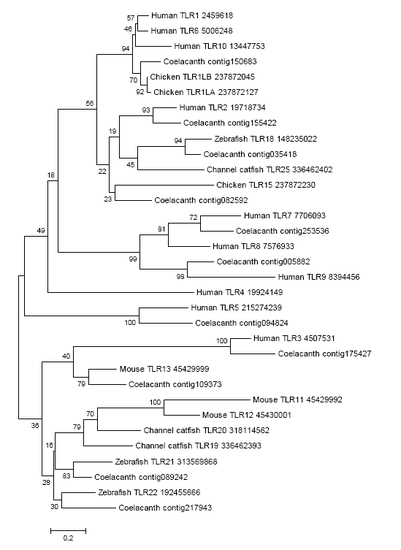
Toll-Like Receptor Phylogeny.The evolutionary history was inferred by using the Maximum Likelihood method based on the JTT matrix-based model for TIR domain of Toll-like receptors. The tree with the highest log likelihood (-4795.6723) is shown. The percentage of trees in which the associated taxa clustered together is shown next to the branches. The tree is drawn to scale, with branch lengths measured in the number of substitutions per site. All positions containing gaps and missing data were eliminated and a total of 102 positions were used. Evolutionary analyses were conducted in MEGA5. |
|
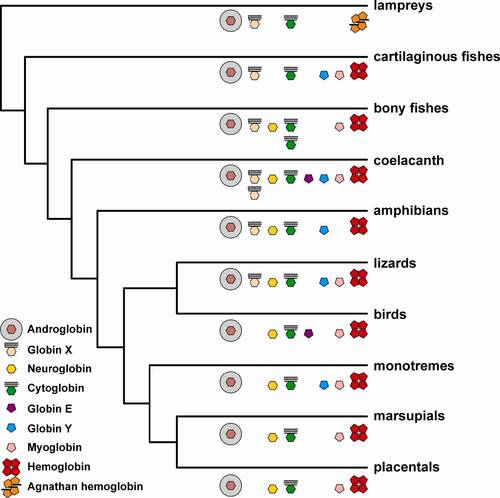
Distribution of globin genes in vertebrates. The hexagon indicates hexacoordinate globins, the pentagon pentacoordinate globins. N- and C-terminal extensions are indicated by bars, the acylation of the N-terminus of GbX is shown. Note the duplicated GbX genes in L. chalumnae and the duplicated Cygb genes in the teleosts. Globin sequences were identified in representative vertebrate genomes employing the BLAST algorithm. The genomes of man (Homo sapiens, build 37.3), mouse (Mus musculus build 37.2), opossum (Monodelphis domestica, build 2.2), chicken (Gallus gallus, build 2.1), zebra finch (Taeniopygia guttata, build 1.1) and zebrafish (Danio rerio, Zv9) were obtained from the NCBI web site at http://www.ncbi.nlm.nih.gov/projects/mapview/. The genome data from the coelacanth (Latimeria chalumnae, LatCha1), platypus (Ornithorhynchus anatinus, OANA5), anole (Anolis carolinensis, AnoCar2.0), clawed frog (Xenopus tropicalis, JGI_4.2), pufferfish (Tetraodon nigroviridis, TETRAODON7) and lamprey (Petromyzon marinus, Pmarinus_7.0) derive from http://www.ensembl.org. The elephant shark (Callorhinchus milii) genome data sequences were obtained from http://esharkgenome.imcb.a-star.edu.sg/. Additional information derives from BLAST searches of the non-redundant nucleotide and ESTs databases. |


