
Image
|
Figure Caption
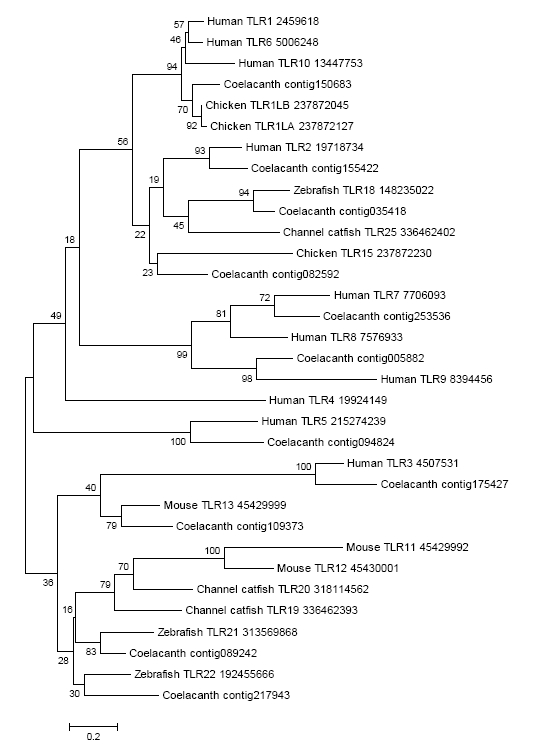
Fig. S18
Toll-Like Receptor Phylogeny.
The evolutionary history was inferred by using the Maximum Likelihood method based on the JTT matrix-based model for TIR domain of Toll-like receptors. The tree with the highest log likelihood (-4795.6723) is shown. The percentage of trees in which the associated taxa clustered together is shown next to the branches. The tree is drawn to scale, with branch lengths measured in the number of substitutions per site. All positions containing gaps and missing data were eliminated and a total of 102 positions were used. Evolutionary analyses were conducted in MEGA5.
Acknowledgments
This image is the copyrighted work of the attributed author or publisher, and
ZFIN has permission only to display this image to its users.
Additional permissions should be obtained from the applicable author or publisher of the image.
Full text @ Nature