
Image
|
Figure Caption
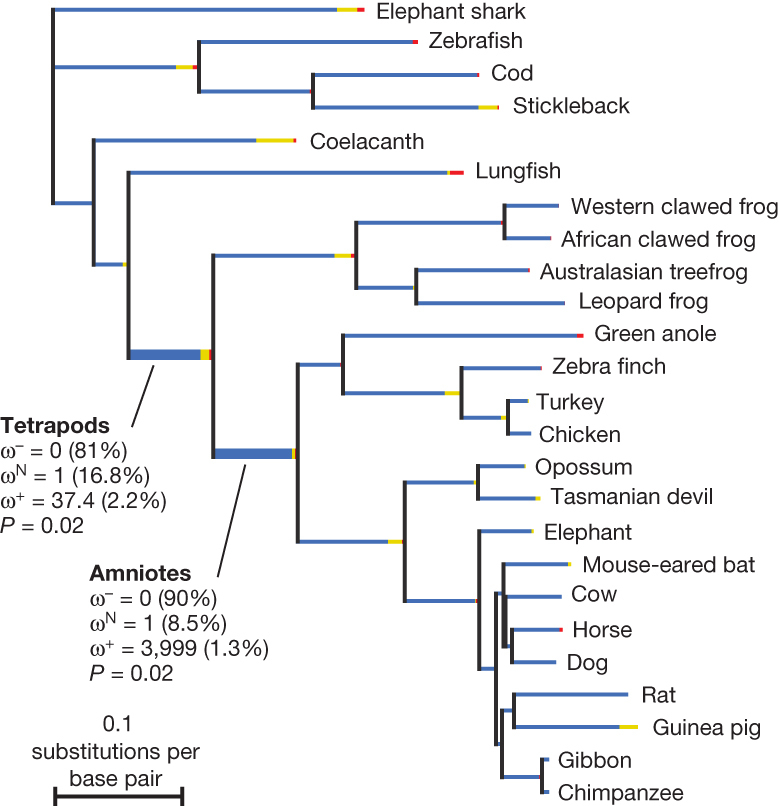
Fig. 3
Branch lengths are scaled to the expected number of substitutions per nucleotide, and branch colours indicate the strength of selection (dN/dS or ω). Red, positive or diversifying selection (ω>5); blue, purifying selection (ω = 0); yellow, neutral evolution (ω = 1). Thick branches indicate statistical support for evolution under episodic diversifying selection. The proportion of each colour represents the fraction of the sequence undergoing the corresponding class of selection.
Acknowledgments
This image is the copyrighted work of the attributed author or publisher, and
ZFIN has permission only to display this image to its users.
Additional permissions should be obtained from the applicable author or publisher of the image.
Full text @ Nature