
- Title
-
Smooth muscle tension induces invasive remodeling of the zebrafish intestine
- Authors
- Seiler, C., Davuluri, G., Abrams, J., Byfield, F.J., Janmey, P.A., and Pack, M.
- Source
- Full text @ PLoS Biol.
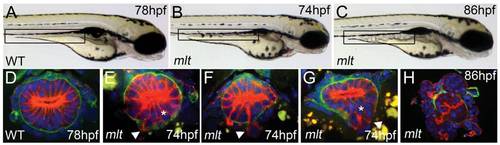
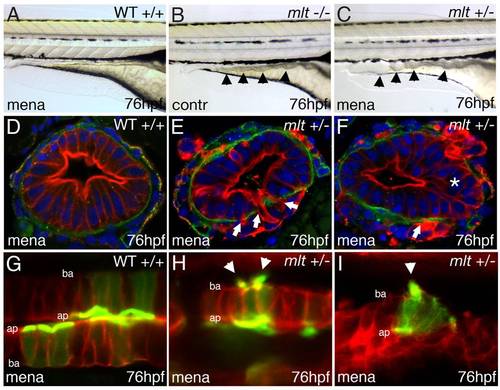
Intestinal epithelial invasion in mlt larvae. (A–C) Live images of wild type (WT) and mlt larvae. In WT (A) the posterior intestine forms a smooth cylindrical tube (box), whereas in mlt at 74 hpf the intestinal contour is irregular (B). Cystic expansion of the intestine is evident in 86 hpf mlt larvae (C). (D–H) Histological cross-sections through the posterior intestine of larvae immunostained for laminin (green) and cytokeratin (red). The WT intestine is comprised of a simple epithelial sheet consisting of a single layer of cells, whereas in mlt epithelial stratification (asterisks) and invasive cells that have breached the basement membrane are evident (E–G arrowheads). The initial invasive behavior is followed by expansive growth and loss of epithelial architecture (H). EXPRESSION / LABELING:
PHENOTYPE:
|

Actin-rich protrusions in invasive epithelial cells of the mlt intestine. (A, B) Full thickness 3-D rendering of sagittal confocal sections through the intestine of 78 hpf wild type (WT) (A) and mlt (B) larvae. Actin is labeled by transgenic Lifeact-GFP expression (green). (A) In WT, the majority of the label is present in the epithelial cell apical brush border (bracket). (B) In mlt, actin-rich invadopodia-like protrusions of the basal epithelial cell membrane are detected (arrows), in addition to brush border actin (bracket). (C) Time lapse analysis of protrusion development. Single sagittal confocal scans through the intestine of a mlt larva beginning at 74 hpf. Basal invadopodia-like protrusions (arrowheads) precede cell invasion, which is first detected at 135 min. Asterisks mark invasive cells at 270 min (see also B). (D–F) Histological cross-sections through the intestine of 74 hpf immunostained mlt larvae. Basement membrane is labeled red (laminin immunostain) and actin labeled green (GFP immunostain in Lifeact-GFP transgenics). Nuclei stained blue with DAPI. Actin rich protrusions in mlt co-localize with sites of basal lamina degradation (arrowheads and insets E, F). During progression of the phenotype epithelial cells invade the tissue stroma through degraded regions of the basal lamina (asterisks in F). ap, apical epithelial cell border; ba, basal cell epithelial cell border. EXPRESSION / LABELING:
PHENOTYPE:
|
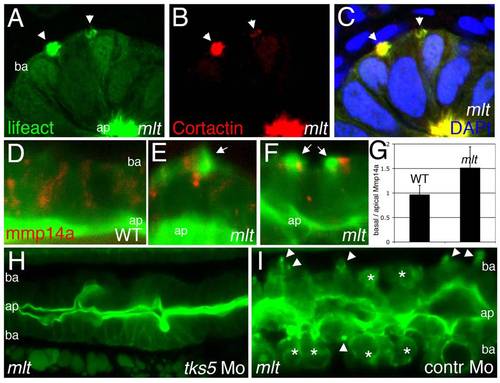
Actin rich protrusions in mlt are invadopodia homologs. (A–C) Histological cross-sections through the posterior intestine of 74 hpf mlt mutant larvae immunostained with antibodies against GFP (green) (labeling Lifeact-GFP) and Cortactin (red). DAPI-stained nuclei, blue. Lifeact-GFP and Cortactin co-localize in actin rich basal membrane protrusions (arrowheads) and in the apical brush border (ap). (D–G) Sagittal confocal scans through the intestine of 74 hpf Lifeact-GFP transgenic wild type (WT) and mlt larvae. Lifeact-GFP binds actin in the apical brush border (ap) of WT (D) and mlt (E, F) epithelial cells, as well as basal (ba) invadopodia-like protrusions in mlt (E, F, arrows). In WT, the Mmp14a-mCherry fusion protein (red) is distributed throughout the epithelial cells. In mlt, Mmp14a-mCherry is preferentially localized to the basal region of the epithelial cells. (n = 33 WT and 33 mlt cells examined; 6 larvae each genotype). (G) Ratio of basal to apical Mmp14a-mCherry in WT versus mlt epithelial cells (error bars, standard deviation. * p<.001). (H–I) Sagittal confocal scans through the intestines of 84 hpf Lifeact-GFP transgenic mlt larvae. Invadopodia (arrowheads I) and invasive cells (asterisks I) are present in the mlt larvae injected with a control morpholino (I), but are not detected in the larvae injected with the tks5 morpholino (H). EXPRESSION / LABELING:
PHENOTYPE:
|

Src induces formation of invadopodia-like protrusions in the intestine of wild type zebrafish larvae. (A–D) Sagittal confocal scans through the intestine of 74 hpf wild type and mlt larvae that express Src-mCherry (red) and Lifeact-GFP (green) in the intestinal epithelium. (A) In WT, Src (red) is localized at the apical (ap) and lateral epithelial cell membrane. (B) In mlt, Src also localizes to sites of actin-rich (green) invadopodia-like protrusions (arrowheads B) arising from the basal epithelial cell membrane (ba). (C) Constitutively active Src (caSrc; red) localizes to invadopodia-like protrusions (green) in mlt (arrowheads). (D) caSrc induces formation of the protrusions in WT (arrowheads). (E) Histological cross-sections through the intestine of a 74 hpf wild type larva showing caSrc-rich protrusions (green) protruding through small degraded regions of the basal lamina (laminin immunostain, red). Additional examples are shown in high power images (E, E′, and E′′). EXPRESSION / LABELING:
PHENOTYPE:
|
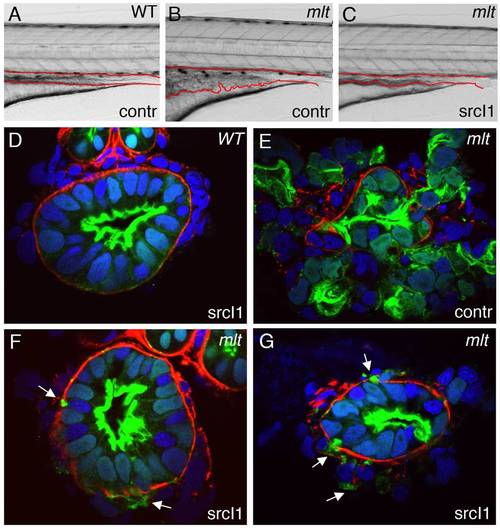
Src inhibition rescues invasion but not formation of invadopodia-like protrusions in mlt. (A–C) Lateral views of live 5 dpf WT (A) and mlt (B, C) larvae. Treatment with the Src-I1 inhibitor rescues invasion in mlt (C). The size of the intestinal epithelium in the treated mlt larva (C) is reduced compared with the untreated mlt larva (B). (D–G) Histological cross-sections of 4 dpf WT (D) and mlt (E–G) Tg(miR194:Lifeact-GFP) larvae immunostained with antibodies against laminin (red) and GFP (green). Nuclei stained blue with DAPI. Arrows point to invadopodia-like protrusions arising from the basal epithelial cell membrane of Src-I1 treated mlt larvae (F, G). Pronounced invasion with distortion of intestinal architecture is evident in the untreated mlt larva (E). Note that invasion is markedly reduced in the Src-I1 treated mlt larvae despite the presence of the invadopodia-like protrusions (white arrows in F, G). |

Tonic intestinal smooth muscle contraction in mlt mutants. Sagittal confocal images from time lapse movies (Movies S7 and S8) of transgenic WT (A–C) and mlt (D–H) larvae (anterior left) expressing fluorescent reporters. Intestinal epithelium (I) and pronephric duct (P) labeled red; intestinal smooth muscle labeled green. WT images beginning at 76 hpf show cycling of the contracted (A, C) and relaxed state (B); brackets depict intestinal diameter. (D–F) The mlt intestine at this stage shows progressive contraction that disrupts intestinal architecture. (G, H) Smooth muscle contraction is not detected in the mlt intestine at the onset of invasive remodeling (72 hpf). (I) Western blot showing premature phosphorylation of h-CaD (p-Cad) in 72 hpf mlt larvae, before the onset of smooth muscle contraction (ratio WT:mlt = 0.17/1, relative to Actin loading control; in four independent experiments, the ratio averaged 0.13/1; p = 0.002). Phospho-h-CaD is present at the onset of contraction in WT at 78 hpf and is comparable to mlt (ratio WT:mlt = 1.12/1, relative to Actin; no significant difference in four independent experiments). Levels of phospho-Myosin light chain (p-Mlc) are low at 72 hpf in both mlt and WT (ratio WT:mlt = 1.16/1, relative to Actin) and are increased when contractions occur at 78 hpf (ratio WT:mlt = 0.96/1, relative to Actin). There was no significant difference between WT and mlt at either time point in four independent experiments. Actin (beta-Actin), loading control. EXPRESSION / LABELING:
PHENOTYPE:
|
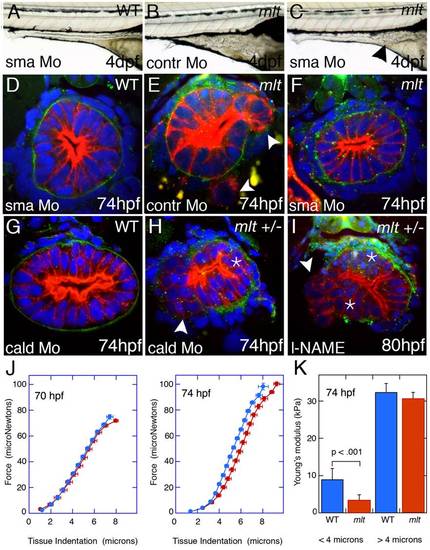
Smooth muscle contraction drives epithelial invasion but does not alter tissue rigidity. (A–C) Lateral views of live 5 dpf larvae injected with Sma or control morpholino. (A) Sma knockdown has no effect on WT intestinal morphology. (B) Control morpholino injection in mlt. (C) Sma knockdown rescues invasion in mlt. Residual invasive cells persist in this Sma deficient mlt larva (arrowhead). (D–I) Histological cross-sections through the posterior intestine of 74 hpf WT and mlt larvae immunostained with anti-keratin (red) and anti-laminin (green) antibodies. (D) WT. (E, F) mlt larvae injected with control (E) and Sma (D, F) morpholinos. Invasive cells in mlt (arrowheads, E) are rescued by Sma knockdown. (G, H) Injection of a morpholino targeting the high molecular weight isoform of Caldesmon (cald) has no effect on WT intestinal morphology but induces invasion (arrowhead) and stratification (asterisk) in an mlt heterozygote. (I) Treatment of an mlt heterozygote with L-NAME causes invasion (arrowhead) and epithelial stratification (asterisk). (J) Force displacement measurements show identical compliance of intestines dissected from mlt and WT larvae before the phenotype develops at 70 hpf, and a modest increase in compliance at the outer surface of the intestine (<4 micron indentation) when invasion is present at 74 hpf. (K) Compliance is indicated by Young′s modulus, which is proportional to the slope of the Force versus Tissue indentation curve. EXPRESSION / LABELING:
PHENOTYPE:
|

Heterozygous mlt larvae are sensitized to oxidative stress. (A) Quantitative RT-PCR shows increased intestinal gpx expression in 74 hpf mlt homozygotes (mlt -/-) compared with WT (+/+) and mlt heterozygotes (mlt +/-) (** p<.01). (A′) Quantitative RT-PCR shows intestinal gpx expression is increased in menadione treated homozygous WT larvae (+/+ mena) compared with untreated WT (contr). A much stronger response to menadione is seen in mlt heterozygotes (+/- mena) (*** p<.001). (B) ROS production in intestinal epithelial cells of 76 hpf WT control larvae (contr) versus menadione treated homozygous WT and heterozygous mlt larvae (*** p<.001). Bar graphs in (A) and (A′) show mean and standard deviation of three independent experiments. Bar graph in (B) shows mean of six larvae for each genotype; 15–25 cells per larva. (C–F) Histological cross-sections of larvae processed for fluorescent RNA in situ hybridization. Menadione induced gpx expression (red) in the epithelium but not smooth muscle (green) of heterozygous mlt larvae (F). This is comparable to the gpx expression pattern in control homozygous mlt larvae (D). (G) Western blot showing premature h-CaD phosphorylation (pCad) in dissected intestines from menadione treated heterozygotes but not homozygous WT larvae (lane 4 versus lane 3; ratio phospho-h-CaD WT:mlt = 0.02/1, relative to total h-CaD; CaD; in six experiments the ratio averaged 0.016/1; p<.001). h-CaD is prematurely phosphorylated in intestines dissected from 74 hpf mlt homozygotes versus mlt heterozygotes (lane 1 versus lane 2). (H) Western blot showing h-CaD phosphorylation (pCad) in the menadione treated heterozygous intestines prior to dissociation (lane 2) but not after dissociation into free cell populations (lane 5). Phospho-h-CaD persists in dissociated cells from homozygous intestines (lane 3), but is not detected in control intestines dissected from mlt heterozygotes, before (lane 1) or after (lane 4) dissociation into free cell populations. No phopho-h-CaD was detected in any dissociated samples in three independent experiments. Loading control, phospho-Myosin light chain (pMlc). EXPRESSION / LABELING:
PHENOTYPE:
|
Oxidative stress induces invasive remodeling in mlt heterozygous larvae. (A–C) Lateral images of live WT (A), mlt homozygous (B), and mlt heterozygous larvae (C). The WT and mlt heterozygous larvae received 3 h of treatment with Menadione beginning at 73 hpf. Menadione treated heterozygote (C) larvae have an intestinal phenotype (arrowheads) resembling the untreated mlt homozygous larvae (B). (D–F) Corresponding histological cross-sections (representative of larvae in A, C) with intestinal epithelial cells labeled red (anti-keratin immunostain) and basement membrane in green (anti-laminin immunostain). Menadione causes epithelial cell invasion (arrows) and stratification (asterisks) in mlt heterozygous larvae (E, F) but does not affect epithelial architecture in the WT intestines (D). (G–I) Sagittal confocal scans through the intestine of WT and mlt heterozygotes treated with menadione. Both larvae express LifeAct-GFP in a subset of intestinal epithelial cells. Actin-rich invadopodia-like protrusions (green) are seen arising from the basal epithelial cell membrane of menadione treated heterozygous larvae (arrowheads, H, I). Actin is located nearly exclusively in the apical brush border of WT epithelial cells (G): Red -membrane mCherry; ba, basal epithelial cell border; ap, apical epithelial cell border. EXPRESSION / LABELING:
PHENOTYPE:
|

Activation of oncogenic signaling enhances sensitivity of mlt heterozygotes to oxidative stress. (A, B) Lateral views of live, menadione treated 5 dpf axin mutant larvae that express mutant KRAS in the intestinal epithelium (Kras-axin). (A) Hypertrophy of the intestinal epithelium in a Kras-axin larva that is homozygous for the wildtype myh11 allele (mlt +/+) larvae is unchanged by treatment with menadione. (B) Menadione treatment causes pronounced cystic expansion of the posterior intestinal epithelium of the Kras-axin mlt heterozygote (arrowheads) that resembles the homozygous mlt phenotype. Inset, immunolabeling of the basal lamina (laminin, green) and epithelium (cytokeratin, red) shows epithelial cell invasion through the basement membrane. (C–E) Histological cross-sections through the intestine of immunostained larvae show invasive cells in menadione treated Kras-axin mlt heterozygotes (arrowheads; D, E). Invasion is not detected in menadione-treated Kras-axin mlt larvae that are homozygous for the wildtype myh11 allele (C). |

tks5 knockdown rescues epithelial invasion in the intestine of mlt mutant larvae. (A–C) Lateral images of live 5 dpf larvae. Control morpholino injected mlt larvae show cystic expansion of the intestinal epithelium (intestinal epithelium outlined in red; lateral view) (B), while only a small number of cysts can still be detected in the tks5 morpholino injected mlt larvae (D, arrowhead). The majority of the posterior intestine in these larvae resembles WT (A, C). Findings confirmed histologically (not shown; n = 6 mlt larvae). |
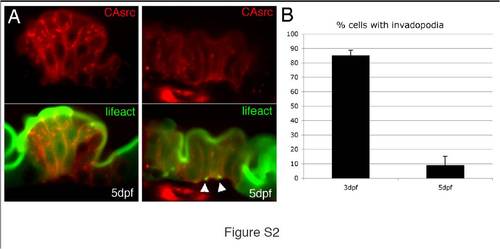
Src induces less invadopodia-like protrusions in mature intestinal epithelial cells than in epithelial progenitor cells. (A) Sagittal confocal scans through the intestine of a 5 dpf Tg(miR194:Lifeact-GFP) with mosaic expression of a caSrc-mCherry transgene. Only a small number of invadopodia-like protrusions are detected (green; arrowheads). (B) Quantification showed that invadopodia-like protrusions were detected in 89% of caSRC-mCherry positive cells in 3 dpf larvae (n = 28 cells in 5 larvae), while they were present in only 9% of cells in 5 dpf larvae (n = 64 cells in 5 larvae). Error bars, standard deviation. |
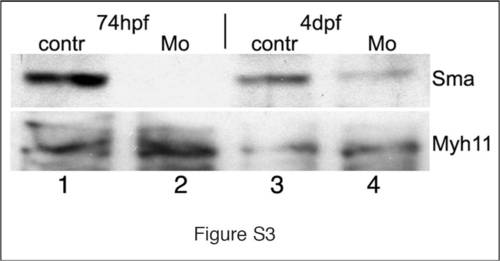
Smooth muscle actin (sma) knockdown rescues mlt mutants. (A–C) Western blot showing reduced Sma protein in the intestine of 74 hpf and 4 dpf Sma MO injected larvae (lane 2, 4) compared to a control MO (lane 1, 3). Myh11 protein levels are unaffected by the Sma knockdown (lanes 1–4). Each lane contains protein extracted from the intestines dissected from 30 larvae. This blot is representative of two independent experiments. |
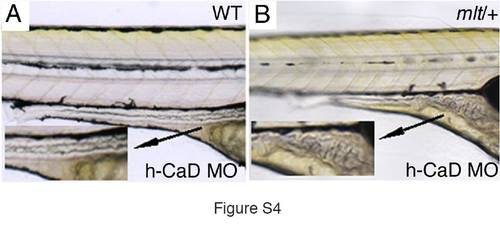
h-CaD knockdown triggers invasion in mlt heterozygotes. Lateral views of 5 dpf WT (A) and mlt/+ (B) larvae that had been injected with a splice-blocking morpholino (MO) that specifically targets h-CaD. Intestinal morphology is normal in the WT larva, whereas there is cystic expansion of the mlt/+ intestine. Histological analyses confirmed invasive expansion of the mlt/+ intestine (Figure 5D and 5E). Invasion was detected in 69% larvae from a mlt/+ intercross (n = 240) of which 66% were predicted to be mlt/+. 12 of 12 genotyped larvae were mlt/+. |
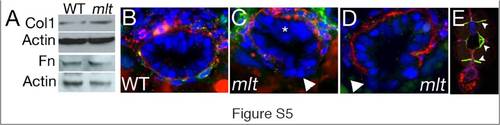
Invasive remodeling occurs without changes in matrix composition or FAK activation. (A) Western blot showing normal levels of Type 1 Collagen (Col1) and Fibronectin (Fn) in the intestine of 74 hpf mlt larvae compared with WT. beta-Actin serves as loading control. (B–D) Histological sections show no activation of FAK by phosphorylation (p-FAK, green) in the epithelium of WT or mlt larvae at 74 hpf. Basement membrane detected with anti-laminin staining (red) (asterisk, stratification; arrowheads, invasive sites). (E) Lower power image showing expected p-FAK (green) in the myoseptum of a WT larva. |
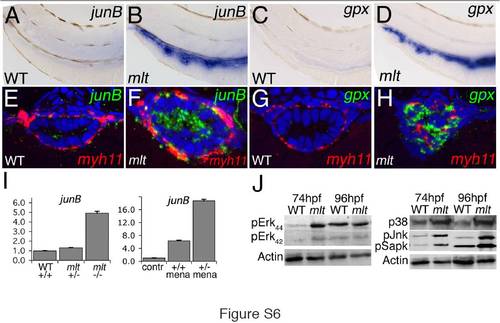
AP-1 transcription factors, ROS responsive genes, and MAP-Kinase signaling are activated in the mlt intestine. (A–D) Whole mount in situ hybridization shows strong expression (blue) of the AP-1 gene junB and the ROS activated gene gluthatione peroxidase (gpx) in the intestine of 74 hpf mlt (B, D) but not WT (A, C) larvae. n = 15 mlt and wild type larvae examined. (E, F) Histological cross-sections of whole mount specimens processed for fluorescent RNA in situ hybridization show strong junB expression (green) in mlt intestinal epithelial cells with only low level expression in smooth muscle cells (labeled red by myh11 expression). (G, H) Similarly, gpx expression (green) can only be detected in the mlt intestinal epithelium. n = 12 mlt and 12 wild type larvae examined. (I) Quantitative RT-PCR shows increased junB expression in the intestine of mlt homozygotes. junB expression is also increased in menadione treated wild type larvae (+/+), and to a greater degree in mlt heterozygous larvae (versus untreated wild type; contr). (J) Western blot showing phosphorylation of several components of the Map-Kinase signaling pathway in intestines dissected from mlt larvae at 74 hpf and 96 hpf. ERK is prematurely activated at 74 hpf in mlt. p38 (Mapk), Jnk, and Sapk are strongly activated in mlt but not WT larvae at 74 hpf and 96 hpf. beta-Actin, loading control. Western blots are representative of between two and four independent experiments. |

Comparable induction of gpx expression in WT larvae that express caSrc and homozygous mlt larvae. (A–C) Whole mount RNA in situ hybridization for gluthatione peroxidase expression (gpx, blue). gpx expression is low in the WT intestine (A), whereas it is markedly elevated in the mlt intestine (B; see also Figures 6C, 6D, S9G, and S9H). n = 15 mlt and 15 wild type larvae. (C) Mosaic expression of a caSrc transgene induces gpx expression in the wild type intestine (C, brackets and arrows). Interestingly, expression of caSrc in the pronephric duct (via the miR194 promoter) also induces gpx expression (C, arrowhead). n = 12 larvae. |