
Fig. 6
- ID
- ZDB-IMAGE-121011-6
- Genes
- Antibodies
- Publication
- Seiler et al., 2012 - Smooth muscle tension induces invasive remodeling of the zebrafish intestine
- All Figures
- Figures for Seiler et al., 2012
|
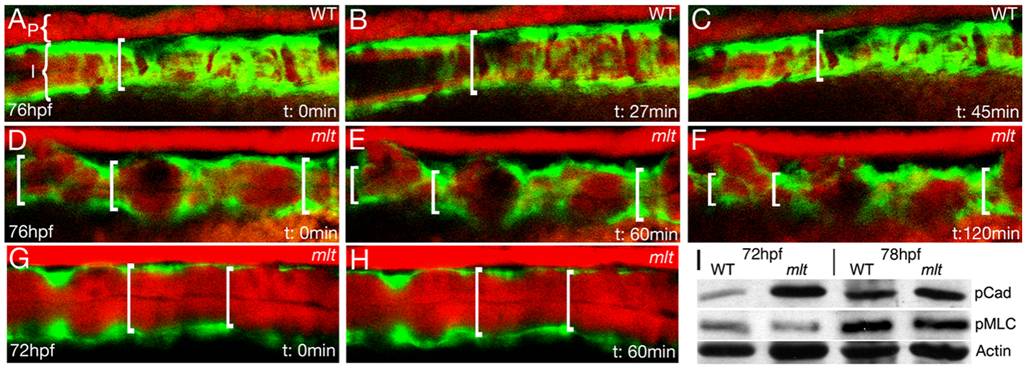
Fig. 6 Tonic intestinal smooth muscle contraction in mlt mutants.
Sagittal confocal images from time lapse movies (Movies S7 and S8) of transgenic WT (A–C) and mlt (D–H) larvae (anterior left) expressing fluorescent reporters. Intestinal epithelium (I) and pronephric duct (P) labeled red; intestinal smooth muscle labeled green. WT images beginning at 76 hpf show cycling of the contracted (A, C) and relaxed state (B); brackets depict intestinal diameter. (D–F) The mlt intestine at this stage shows progressive contraction that disrupts intestinal architecture. (G, H) Smooth muscle contraction is not detected in the mlt intestine at the onset of invasive remodeling (72 hpf). (I) Western blot showing premature phosphorylation of h-CaD (p-Cad) in 72 hpf mlt larvae, before the onset of smooth muscle contraction (ratio WT:mlt = 0.17/1, relative to Actin loading control; in four independent experiments, the ratio averaged 0.13/1; p = 0.002). Phospho-h-CaD is present at the onset of contraction in WT at 78 hpf and is comparable to mlt (ratio WT:mlt = 1.12/1, relative to Actin; no significant difference in four independent experiments). Levels of phospho-Myosin light chain (p-Mlc) are low at 72 hpf in both mlt and WT (ratio WT:mlt = 1.16/1, relative to Actin) and are increased when contractions occur at 78 hpf (ratio WT:mlt = 0.96/1, relative to Actin). There was no significant difference between WT and mlt at either time point in four independent experiments. Actin (beta-Actin), loading control.