- Title
-
Distinct Cellular Mechanisms of Blood Vessel Fusion in the Zebrafish Embryo
- Authors
- Herwig, L., Blum, Y., Krudewig, A., Ellertsdottir, E., Lenard, A., and Belting, H.G., and Affolter, M.
- Source
- Full text @ Curr. Biol.
|
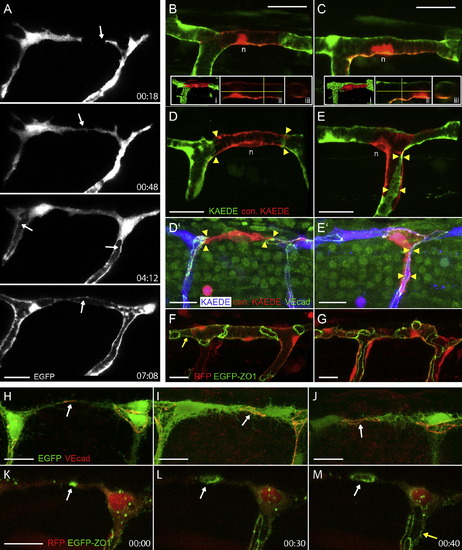
Anastomosis and Heterogeneity of Endothelial Tubes (A) Still pictures of a time-lapse movie (data not shown) showing steps during dorsal longitudinal anastomotic vessel (DLAV) formation. Tip cells reach the dorsal side of the embryo and send filopodia in anterior and posterior directions (arrow in 00:18 [hr:min]). The tip cells contact each other and form the future DLAV (arrow in 00:48). Later the lumen opens from the stalk and proceeds into the DLAV (arrows in 4:12 and 7:08). (B–G) Different vessel architectures are found in the intersegmental vessel (ISV)/DLAV. Single, photoconverted cells (red) show a unicellular (B) or a multicellular arrangement (C). Inserts (i–iii) in (B) and (C) show a surface calculation (i), a sagittal section (ii), and a cross-section (iii) at the sites indicated by cross-hairs (n = nucleus). (D–E′) Single photoconverted cells (red) and corresponding VE-cadherin (VE-cad) immunostainings. Arrowheads indicate regions of unicellular (D and D2) and multicellular (E and E2) tubes. A unicellular tube outlined by EGFP-zona occludens 1 (ZO1) fusion protein is shown in (F), and multicellular/unicellular and mixed arrangements represented by EGFP-ZO1 protein are shown in (G). The yellow arrow in (F) points at delocalized EGFP-ZO1 protein in the cell membrane, most likely due to elevated levels of protein. (H–J) VE-cad immunostainings of 30 hrs postfertilization (hpf) old fli:EGFP embryos. Spots and small and larger rings are shown in (H), (I), and (J), respectively (see arrows). (K–M) Still pictures of Movie S1 showing a time-lapse of a fli:GAL4FF; UAS:RFP; UAS:EGFP-ZO1 embryo. An initial contact spot of EGFP-ZO1 (arrow in K) is elaborated into a small (arrow in L) and subsequently into a larger loop (arrow in M; Movie S1). The yellow arrow in (M) points to delocalized EGFP-ZO1 in the cell membrane (compare F and Figure S1). Scale bar in all pictures represents 20 μm. EXPRESSION / LABELING:
|
|
Anastomosis by Cord Hollowing Still pictures from Movie S2 showing a time-lapse of a fli:GAL4FF; UAS:RFP; UAS:EGFP-ZO1 embryo (total length: 9:20). (A–C) A tip cell has established contact with an adjacent tip cell (right arrow) and has contact with a stalk cell (left arrow), which results in two loops of EGFP-ZO1 (A). These loops extend and eventually meet (B and C). (A′–D′) shows the junctional outline of participating cells (yellow: “central” cell, green: stalk cell, red: DLAV cell moving in from posterior [right]). The two initial cell contacts are shown in yellow/green and yellow/red, respectively. When the stalk cell and the adjacent DLAV cell meet, they establish a new contact with “green and red” junctions (arrow in D, green and red line in D′). Scale bar in all pictures represents 20 μm. |
|
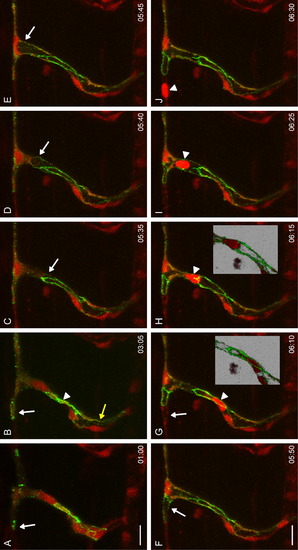
Anastomosis by Membrane Invagination Still pictures from Movie S3 showing a time-lapse of a Tg(fli:GAL4FFubs3; UAS:mRFPrk8; UAS:EGFP-ZO1ubs5) embryo (total length: 10:25). (A and B) A tip cell has formed initial contacts and subsequently forms loops of EGFP-ZO1 with its adjacent partner (white arrows). The stalk shows a multicellular organization (two lines of EGFP-ZO1, arrowhead in B) and an opening lumen (yellow arrow in B). (C) The lumen projects into the fusion cell (follow arrow from C to E) and finally reaches the left ring of EGFP-ZO1, which is subsequently inflated (arrow in F). The lumen then continues to extend into the unlabeled fusion cell on the left (arrow in G). A blood cell then passes through the newly formed lumen (follow arrowhead from G–J). Insets show the blood cell passing behind the junction (G) and in front of the junction (H). More examples of membrane invagination are shown in Movie S4, Movie S6, and Figures S3B and S3C. Scale bar in all pictures represents 20 μm. |
|
Visualization of Apical Membrane during Anastomosis (A–A′′) Pdxl2 antibodies label apical cell membranes in ISVs and DLAV at 48 hpf. (B–B′′) Pdxl2 is localized within a junctional ring (arrow) at the contact site of two tip cells at the onset of anastomosis (36 hpf). (C–C′′) Apical membrane invaginating into a tip cell at 36 hpf is shown by Pdxl2 immunostaining. (D–D′) In sih morphants at the same stage, the Pdxl2 staining is only seen within the junctional rings, indicating that apical membrane invagination does not take place in the absence of blood flow. Also compare Movie S3 and Figure S3A. α-ZO1 is shown in white, α-Pdxl2 in green, and kdrl:EGFP in red. Scale bar in all pictures represents 20 μm. |
|
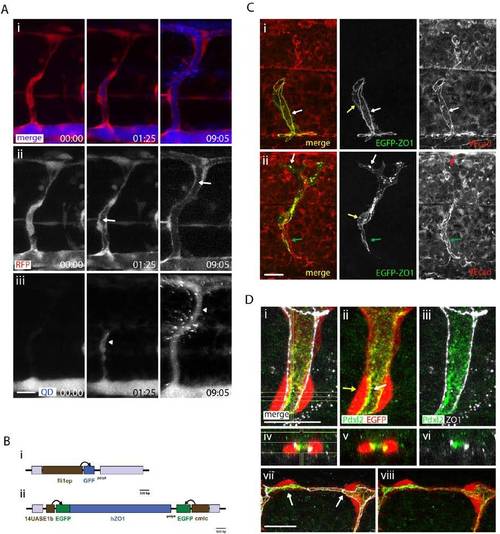
QD Labeling of the Lumen and Characterization of fli1ep:Gal4ffubs3;UAS:ZO1-EGFPubs5 Transgenic Lines, Related to Figure 1 EXPRESSION / LABELING:
|
|
Lumen Invagination Visualized by QD Injection, Related to Figure 4 (A) Cell rearrangements do not depend on blood circulation. Series of pictures from movie S3. Fusion spots are transformed into rings (arrow at 01:50) and cell rearrangements (arrows at 08:25 and 10:20) still occur in sih morphant embryos. |


