
- Title
-
Visualization, characterization and modulation of calcium signaling during the development of slow muscle cells in intact zebrafish embryos
- Authors
- Cheung, C.Y., Webb, S.E., Love, D.R., and Miller, A.L.
- Source
- Full text @ Int. J. Dev. Biol.
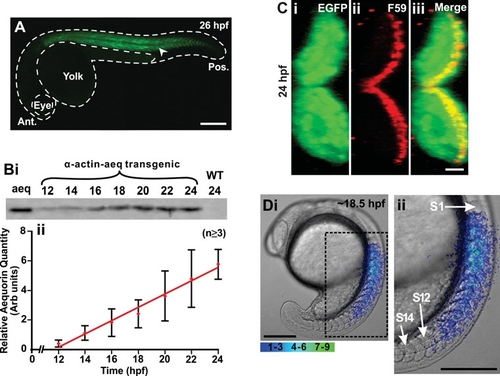
Characterization of the transgenic zebrafish line that expresses the apoaequorin and EGFP genes, which are targeted to the skeletal muscle via a muscle specific α-actin promoter. (A) Expression of EGFP (see arrowhead) in the trunk musculature of a representative α-actin-aeq transgenic (F1) embryo at 26 hpf. This embryo was bred by crossing the single pα-KS-Aeq-IRES-EGFP plasmid-injected founder fish (F0) generated, with a wild-type fish. Ant. and Pos. are anterior and posterior, respectively. (B) Profile of apoaequorin expression in the F1 transgenic embryos from 12 hpf to 24 hpf. (Bi) Representative example (n=3) of a Western blot and (Bii) a line graph (mean ± SEM; n≥3) to illustrate the relative level and temporal expression profile of apoaequorin in extract prepared from the transgenic embryos. Aeq, aequorin control; WT, wild-type embryos. Extract prepared from 3 embryos was loaded into each lane. (C) Cross section of the myotome of a representative (n=5) transgenic zebrafish embryo at 24 hpf illustrating (Ci) the expression of EGFP, (Cii) the slow muscles (labeled via immunohistochemistry with the F59 myosin heavy chain antibody), and (Ciii) the EGFP and F59-labeled images when merged, such that the yellow color indicates the region of overlap. (Di) A representative example (n=4) of the spatial pattern of Ca2+ transients generated in the trunk of an apoaequorin expressing transgenic embryo at ~18.5 hpf. This image represents 10 sec of accumulated light superimposed on to the appropriate bright-field image. The region of the embryo bounded by the black dashed square is shown at higher magnification in Dii. S1, S12 and S14 are somites 1, 12 and 14, respectively. Color scale indicates luminescent flux in photons/pixel. Scale bars are (A) 250 μm, (C) 10 μm, and (D) 200 μm. |
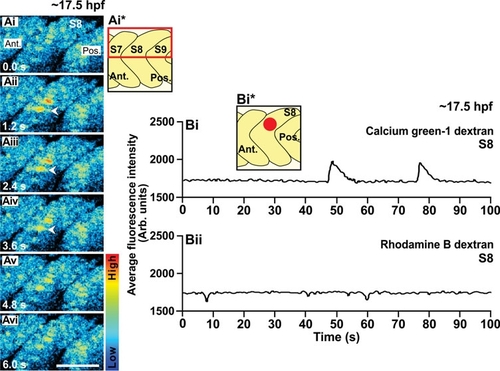
An example of the Ca2+ signals generated in the trunk of a wild-type embryo at ~17.5 hpf (i.e., the 17-somite stage), as visualized by confocal microscopy using calcium green-1 dextran. (Ai-Avi) Representative (n=3) single confocal sections to show the Ca2+ signals generated in the dorsal half of somite 7, 8 and 9 (see the schematic, panel Ai*). The time interval between each image was ~1.2 sec. The color scale represents the level of [Ca2+]i, where red indicates a high level and blue indicates a low level. Ant. and Pos. are anterior and posterior, respectively. Scale bar, 50 μm. (Bi) Temporal profile of the average calcium green-1 dextran fluorescence intensity (in Arb. units) recorded in an ROI covering ~4-5 SMCs (i.e., ~800 μm2) placed in the dorsal part of somite 8 of this wild-type embryo at ~17.5 hpf (see schematic, panel Bi*). (Bii) Temporal profile of the average rhodamine B dextran fluorescence intensity (in Arb. units) recorded in the same ROI over the same time period. |

An example of the Ca2+ signals generated in the trunk of a wild-type embryo at ~18.5 hpf as visualized by confocal microscopy using calcium green-1 dextran. (Ai-Av) Representative (n=3) single confocal sections to show the Ca2+ signals generated in somites 7, 8, 9 and 10 at ~18.5 hpf (i.e., the 19-somite stage). The time interval between each image was 1.16 sec. The color scale represents the level of [Ca2+]i, where red indicates a high level and blue indicates a low level. Ant. and Pos. are anterior and posterior, respectively. Scale bar is 50 μm. (Bi- Biv) Temporal profiles of average calcium green-1 dextran fluorescence intensity (in Arb. units) recorded in four ROIs (each covering ~4-5 SMCs, i.e., ~800 μm2) placed in the middle of somites 7, 8, 9 and 10 of this wild-type embryo at ~18.5 hpf (see schematic, panel Bi*). The three red dashed lines help to illustrate the synchronized nature of these signals. (Bv) Temporal profile of average rhodamine B dextran fluorescence intensity (in Arb. units) recorded in an ROI placed in the middle of somite 8 (see schematic, panel Bv*). (C) Temporal profiles of average calcium green-1 dextran fluorescence intensity (in Arb. units) in the dorsal (green), medial (red) and ventral (blue) regions of somite 9, which indicate that the majority of the Ca2+ signals in the dorsal, medial and ventral regions of the somite also occur in synchrony. (C*) Schematic to show the dorsal (D), medial (M) and ventral (V) ROIs. |

A Ca2+ signal generated in a single muscle cell in the trunk of an intact embryo at ~18.5 hpf (i.e., the 19-somite stage). Embryos (n=3) were loaded with calcium green-1 dextran (10S) at the 1-cell stage and images were acquired via confocal microscopy. (A) Schematic diagram to show the position of somite 10 (red box) in the zebrafish embryo where the Ca2+ signal was acquired. (B) Bright-field image of somite 10 with the position of the imaged cell indicated (see red box). (C) Single confocal sections to show the Ca2+ signal generated in the imaged cell over a period of ~8 s. The images were acquired every ~0.58 sec. The nucleus is outlined with a white dashed line in the first panel. The color scale represents the level of [Ca2+]i, where red indicates a high level and blue indicates a low level. Ant. and Pos. are anterior and posterior, respectively. Scale bars are (B) 25 μm and (C) 10 μm. (D) Temporal profile of the fold change in fluorescence intensity in the nucleus and cytoplasm in this muscle cell for the duration of the Ca2+ signal. |
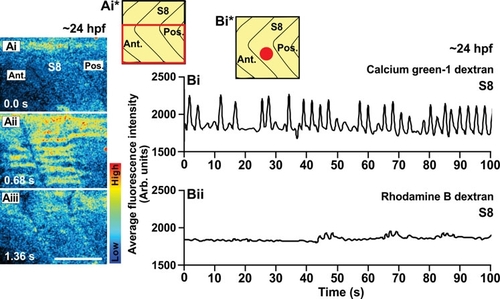
An example of the Ca2+ signals generated in the trunk of a wildtype embryo at ~24 hpf (i.e., the Prim-5 stage) as visualized by confocal microscopy using calcium green-1 dextran. (Ai-Aiii) Representative (n=3) single confocal sections to show the Ca2+ signals generated in the ventral half of somite 8 (see the schematic, panel Ai*). The time interval between each image was 0.68 sec. The color scale represents the level of [Ca2+]i, where red indicates a high level and blue indicates a low level. Ant. and Pos. are anterior and posterior, respectively. Scale bar, 50 μm. (Bi) Temporal profile of the average calcium green-1 dextran fluorescence intensity (in Arb. units) recorded in an ROI covering ~4-5 SMCs (i.e., ~800 μm2) placed in the ventral part of somite 8 of this wild-type embryo at ~24 hpf (see schematic, panel Bi*). (Bii) Temporal profile of average rhodamine B dextran fluorescence intensity (in Arb. units) recorded in the same ROI over the same time period. |

Effect of cyclopamine and forskolin on slow muscle development and Ca2+ signaling in the trunk. (Ai to Di) Representative bright-field images of embryos at 24 hpf that were either (Ai) untreated (controls), or else that were treated from 5.5 hpf with (Bi) 2% DMSO (DMSO-control), (Ci) 0.1 mM cyclopamine or (Di) 0.15 mM forskolin (n=4 for each of the untreated and drug-treated embryos). (Aii-Dii) The somites of the embryos shown in (Ai-Di), respectively, are shown at higher magnification. (Aiii-Diii) Projected stacks of confocal images through the trunk (at the position of somite 8; S8) of embryos treated as described for (Ai-Di), respectively, prior to fixation at 24 hpf and then the SMCs labeled by immunohistochemistry with the F59 myosin heavy chain antibody. Arrowheads in (Diii) indicate the few SMCs that still formed in the forskolin-treated embryos. Ant. and Pos. are anterior and posterior, respectively. Scale bars are (Ai-Di) 250 μm, (Aii-Dii) 50 μm and (Aiii-Diii) 25 μm. (Aiv-Div) Profiles of aequorin-generated light from α-actin-aeq transgenic embryos treated as described for (Ai-Di), respectively, from 17 hpf to 21 hpf (i.e., the ~16- to 24-somite stage). Data were plotted every 10 s, each data point representing 10 sec of accumulated luminescence for an ROI covering the entire embryo (i.e., 1.24 mm2). |
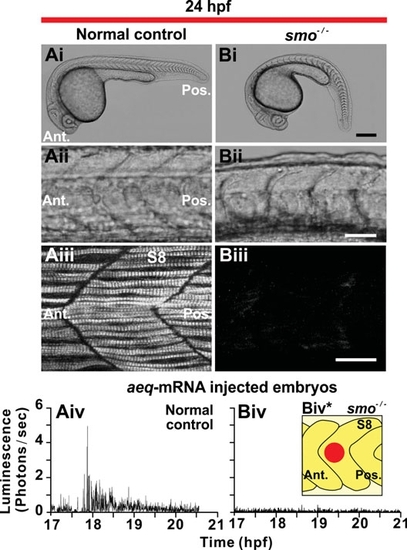
Slow muscle development and Ca2+ signaling in the trunk of smo-/- mutant embryos. (Ai,Bi) Representative bright-field images of (Ai) normal control (n=3) or (Bi) smo-/- mutant embryos (n=3), at 24 hpf. (Aii,Bii) The somites of the embryos shown in (Ai,Bi), respectively, are shown at higher magnification. (Aiii,Biii) Projected stacks of confocal images through the trunk (at the level of somite 8; S8) of (Aiii) normal control and (Biii) smo-/- mutant embryos that were fixed at 24 hpf and then the SMCs labeled by immunohistochemistry with the F59 myosin heavy chain antibody. Ant. and Pos. are anterior and posterior, respectively. Scale bars are (Ai,Bi) 250 μm, (Aii,Bii) 50 μm and (Aiii,Biii) 25 μm. (Aiv,Biv) Profiles of aequorin-generated light from aeq-mRNA injected (Aiv) normal (control) and (Biv) smo-/- mutant embryos from ~17 hpf to ~21 hpf (i.e., the ~16- to 24-somite stage). Data were plotted every 10 s, with each data point representing 10 sec of accumulated luminescence for an ROI covering ~8000 μm2 on somite 8 (Biv*). |
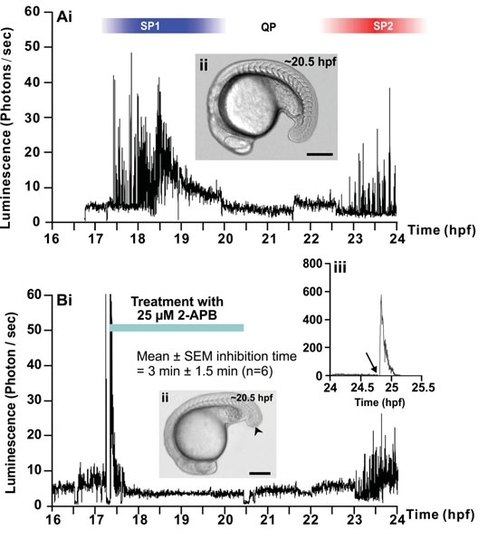
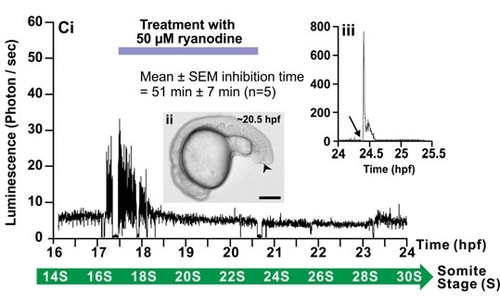
Effect of 2-APB and ryanodine on the trunk Ca2+ signals. Representative temporal profiles of the luminescence generated by α-actin-aeq transgenic embryos that were (Ai) untreated (control; n=9) or treated with (Bi) 25 μM 2-APB (n=6) or (Ci) 50 μM ryanodine (n=7) for 3 hours as soon as the SP1 Ca2+ signals were observed (i.e., at ~17.5 hpf). Data were plotted every 10 s, with each data point representing 10 sec of accumulated luminescence for an imaging field covering the entire embryo (i.e., ~1.24 mm2) from ~16-17 hpf to 24 hpf (i.e., the ~14- to 30-somite stage). Ca2+ signaling period 1 (SP1), Ca2+ signaling quiet period (QP), and Ca2+ signaling period 2 (SP2), observed in the untreated embryo, are shown. (Aii, Bii, Cii) Bright-field images of the (Aii) untreated, (Bii) 2-APBand (Cii) ryanodine-treated embryos at ~20.5 hpf. The arrowheads in (Bii,Cii) indicate the location of the tail-cut procedure, where ~100 μm of the terminal portion of the tail bud was removed. This procedure was performed just prior to incubation with the drugs. Scale bars are 250 μm. (Biii,Ciii) Temporal profiles of the luminescence generated at the end of each imaging experiment when triton X-100 was added (see arrows) to the embryos in order to permeabilize the plasma membrane and thus expose any unspent cytoplasmic aequorin to extracellular Ca2+. |
Effect of 2-APB and ryanodine on the trunk Ca2+ signals. Representative temporal profiles of the luminescence generated by ;;alpha;-actin-aeq transgenic embryos that were (Ai) untreated (control; n=9) or treated with (Bi) 25 ;;mu;M 2-APB (n=6) or (Ci) 50 ;;mu;M ryanodine (n=7) for 3 hours as soon as the SP1 Ca2+ signals were observed (i.e., at ~17.5 hpf). Data were plotted every 10 s, with each data point representing 10 sec of accumulated luminescence for an imaging field covering the entire embryo (i.e., ~1.24 mm2) from ~16-17 hpf to 24 hpf (i.e., the ~14- to 30-somite stage). Ca2+ signaling period 1 (SP1), Ca2+ signaling quiet period (QP), and Ca2+ signaling period 2 (SP2), observed in the untreated embryo, are shown. (Aii, Bii, Cii) Bright-field images of the (Aii) untreated, (Bii) 2-APBand (Cii) ryanodine-treated embryos at ~20.5 hpf. The arrowheads in (Bii,Cii) indicate the location of the tail-cut procedure, where ~100 ;;mu;m of the terminal portion of the tail bud was removed. This procedure was performed just prior to incubation with the drugs. Scale bars are 250 ;;mu;m. (Biii,Ciii) Temporal profiles of the luminescence generated at the end of each imaging experiment when triton X-100 was added (see arrows) to the embryos in order to permeabilize the plasma membrane and thus expose any unspent cytoplasmic aequorin to extracellular Ca2+. |
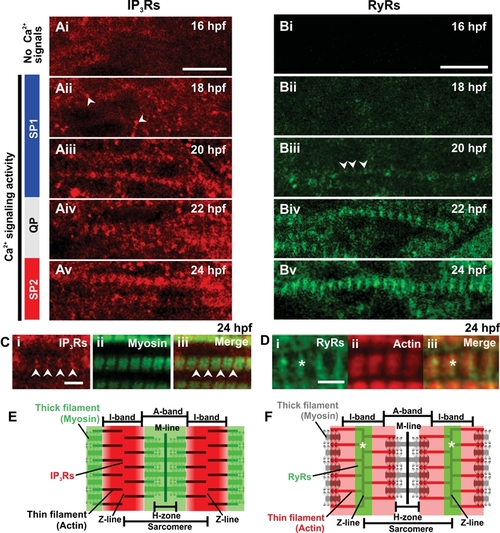
Expression of IP3Rs and RyRs in the trunk musculature. (A,B) Embryos were fixed at the times indicated in the upper right corner of each panel and then the (A) IP3Rs and (B) RyRs were labeled via immunohistochemistry with the anti-Ins3R (Type 1) and 34C antibodies, respectively. Small clusters of IP3Rs at 18 hpf (Aii), and RyRs at 20 hpf (Biii) are indicated with white arrowheads. (C) Dual labeling of (Ci) IP3Rs and (Cii) myosin at 24 hpf. (Ciii) The IP3R and myosin images when merged. Arrowheads indicate the position of the IP3Rs in the z-line SR. (D) Dual labeling of (Di) RyRs and (Dii) actin at 24 hpf. (Diii) The RyR and actin images when merged. Asterisks indicate the position of the RyRs. In (C,D), myosin was labeled via immunohistochemistry with the F59 antibody and actin was labeled with rhodamine phalloidin. (E,F) Schematic representations of a sarcomere to show (E) the pattern IP3R labeling with respect to myosin, and (F) the pattern of RyR labeling with respect to actin. Scale bars are (A,B) 10 μm and (C,D) 3 μm. |

Expression of myosin and actin in the trunk musculature between 16 hpf and 24 hpf. (A-F) Embryos were fixed at the times indicated in the upper right corner of each row of panels and then (Ai-Fi) the myosin was labeled via immunohistochemistry with the F59 myosin heavy chain antibody and (Aii-Fii) the F-actin was labeled with rhodamine phalloidin. (Aiii-Fiii) The merged myosin and F-actin images, with the overlapping regions shown in yellow. Ca2+ signaling periods 1 and 2 (SP1 and SP2), and the Ca2+ signaling quiet period (QP; from Fig. 3) are also shown. (Gi-Giii) Higher magnification views of (Fi-Fiii), respectively, showing the pattern of sarcomeric banding in the muscle fibers at 24 hpf. (Giii*) Higher magnification view of (Giii). S, A, H and I are sarcomere, A-band, H-zone and I-band, respectively. Scale bars are (A-F) 25 μm, (Gi-Giii) 5 μm and (Giii*) 1 μm. (H) Schematic representation of a sarcomere. |
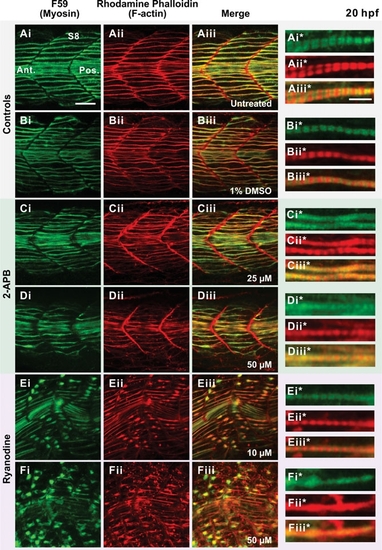
Effect of 2-APB and ryanodine on the organization of the trunk musculature and the formation of sarcomeres. Embryos were either (A) untreated (controls) or else (B-F) treated from 17 hpf to 20 hpf with: (B) 1% DMSO (DMSO control); (C,D) 2-APB at (C) 25 μM or (D) 50 μM; or (E,F) ryanodine at (E) 10 μM or (F) 50 μM. Embryos were then fixed and the myosin and F-actin labeled with (Ai-Fi) the F59 myosin heavy chain antibody and (Aii-Fii) rhodamine-phalloidin, respectively. (Aiii-Fiii) The merged myosin and F-actin images, with the overlapping regions shown in yellow. (Ai*-Aiii* to Fi*-Fiii*) Higher magnification views of (Ai-Aiii - Fi-Fiii), respectively, showing the level of sarcomeric banding in the slow muscle fibers in the untreated and drug treated embryos. Scale bars are (Ai-Aiii to Fi-Fiii) 25 μm and (Ai*-Aiii* to Fi*-Fiii*) 5 μm. |