
Fig. 10
- ID
- ZDB-FIG-110907-15
- Publication
- Cheung et al., 2011 - Visualization, characterization and modulation of calcium signaling during the development of slow muscle cells in intact zebrafish embryos
- Other Figures
- All Figure Page
- Back to All Figure Page
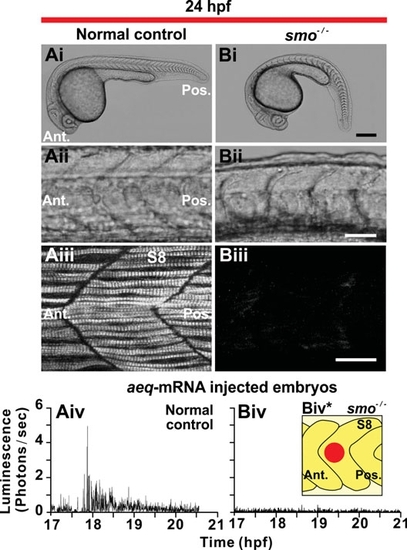
Slow muscle development and Ca2+ signaling in the trunk of smo-/- mutant embryos. (Ai,Bi) Representative bright-field images of (Ai) normal control (n=3) or (Bi) smo-/- mutant embryos (n=3), at 24 hpf. (Aii,Bii) The somites of the embryos shown in (Ai,Bi), respectively, are shown at higher magnification. (Aiii,Biii) Projected stacks of confocal images through the trunk (at the level of somite 8; S8) of (Aiii) normal control and (Biii) smo-/- mutant embryos that were fixed at 24 hpf and then the SMCs labeled by immunohistochemistry with the F59 myosin heavy chain antibody. Ant. and Pos. are anterior and posterior, respectively. Scale bars are (Ai,Bi) 250 μm, (Aii,Bii) 50 μm and (Aiii,Biii) 25 μm. (Aiv,Biv) Profiles of aequorin-generated light from aeq-mRNA injected (Aiv) normal (control) and (Biv) smo-/- mutant embryos from ~17 hpf to ~21 hpf (i.e., the ~16- to 24-somite stage). Data were plotted every 10 s, with each data point representing 10 sec of accumulated luminescence for an ROI covering ~8000 μm2 on somite 8 (Biv*). |