
Fig. 12a
- ID
- ZDB-FIG-110907-16
- Publication
- Cheung et al., 2011 - Visualization, characterization and modulation of calcium signaling during the development of slow muscle cells in intact zebrafish embryos
- Other Figures
- All Figure Page
- Back to All Figure Page
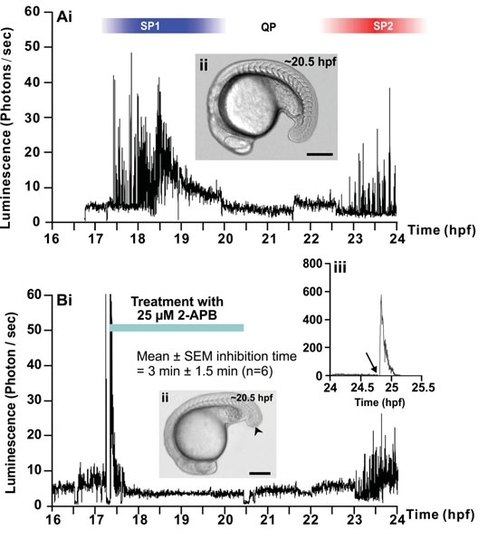
Effect of 2-APB and ryanodine on the trunk Ca2+ signals. Representative temporal profiles of the luminescence generated by α-actin-aeq transgenic embryos that were (Ai) untreated (control; n=9) or treated with (Bi) 25 μM 2-APB (n=6) or (Ci) 50 μM ryanodine (n=7) for 3 hours as soon as the SP1 Ca2+ signals were observed (i.e., at ~17.5 hpf). Data were plotted every 10 s, with each data point representing 10 sec of accumulated luminescence for an imaging field covering the entire embryo (i.e., ~1.24 mm2) from ~16-17 hpf to 24 hpf (i.e., the ~14- to 30-somite stage). Ca2+ signaling period 1 (SP1), Ca2+ signaling quiet period (QP), and Ca2+ signaling period 2 (SP2), observed in the untreated embryo, are shown. (Aii, Bii, Cii) Bright-field images of the (Aii) untreated, (Bii) 2-APBand (Cii) ryanodine-treated embryos at ~20.5 hpf. The arrowheads in (Bii,Cii) indicate the location of the tail-cut procedure, where ~100 μm of the terminal portion of the tail bud was removed. This procedure was performed just prior to incubation with the drugs. Scale bars are 250 μm. (Biii,Ciii) Temporal profiles of the luminescence generated at the end of each imaging experiment when triton X-100 was added (see arrows) to the embryos in order to permeabilize the plasma membrane and thus expose any unspent cytoplasmic aequorin to extracellular Ca2+. |