
Fig. 13
- ID
- ZDB-FIG-110907-18
- Publication
- Cheung et al., 2011 - Visualization, characterization and modulation of calcium signaling during the development of slow muscle cells in intact zebrafish embryos
- Other Figures
- All Figure Page
- Back to All Figure Page
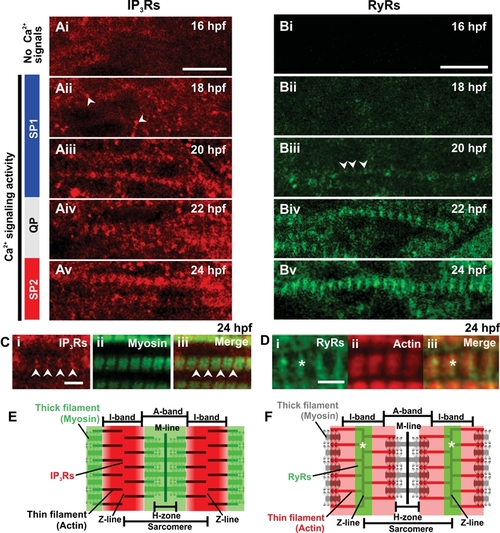
Expression of IP3Rs and RyRs in the trunk musculature. (A,B) Embryos were fixed at the times indicated in the upper right corner of each panel and then the (A) IP3Rs and (B) RyRs were labeled via immunohistochemistry with the anti-Ins3R (Type 1) and 34C antibodies, respectively. Small clusters of IP3Rs at 18 hpf (Aii), and RyRs at 20 hpf (Biii) are indicated with white arrowheads. (C) Dual labeling of (Ci) IP3Rs and (Cii) myosin at 24 hpf. (Ciii) The IP3R and myosin images when merged. Arrowheads indicate the position of the IP3Rs in the z-line SR. (D) Dual labeling of (Di) RyRs and (Dii) actin at 24 hpf. (Diii) The RyR and actin images when merged. Asterisks indicate the position of the RyRs. In (C,D), myosin was labeled via immunohistochemistry with the F59 antibody and actin was labeled with rhodamine phalloidin. (E,F) Schematic representations of a sarcomere to show (E) the pattern IP3R labeling with respect to myosin, and (F) the pattern of RyR labeling with respect to actin. Scale bars are (A,B) 10 μm and (C,D) 3 μm. |