
Fig. 8
- ID
- ZDB-IMAGE-110907-9
- Publication
- Cheung et al., 2011 - Visualization, characterization and modulation of calcium signaling during the development of slow muscle cells in intact zebrafish embryos
- All Figures
- Figures for Cheung et al., 2011
|
Fig. 8
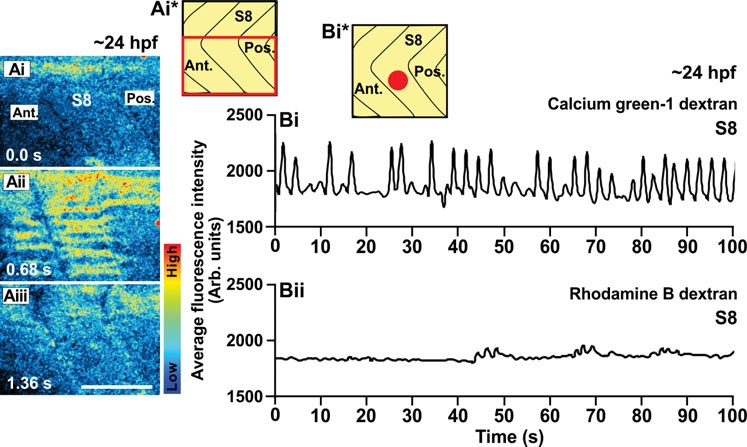
An example of the Ca2+ signals generated in the trunk of a wildtype embryo at ~24 hpf (i.e., the Prim-5 stage) as visualized by confocal microscopy using calcium green-1 dextran. (Ai-Aiii) Representative (n=3) single confocal sections to show the Ca2+ signals generated in the ventral half of somite 8 (see the schematic, panel Ai*). The time interval between each image was 0.68 sec. The color scale represents the level of [Ca2+]i, where red indicates a high level and blue indicates a low level. Ant. and Pos. are anterior and posterior, respectively. Scale bar, 50 μm. (Bi) Temporal profile of the average calcium green-1 dextran fluorescence intensity (in Arb. units) recorded in an ROI covering ~4-5 SMCs (i.e., ~800 μm2) placed in the ventral part of somite 8 of this wild-type embryo at ~24 hpf (see schematic, panel Bi*). (Bii) Temporal profile of average rhodamine B dextran fluorescence intensity (in Arb. units) recorded in the same ROI over the same time period.