
Fig. 12b
- ID
- ZDB-IMAGE-110907-13
- Publication
- Cheung et al., 2011 - Visualization, characterization and modulation of calcium signaling during the development of slow muscle cells in intact zebrafish embryos
- All Figures
- Figures for Cheung et al., 2011
|
Fig. 12b
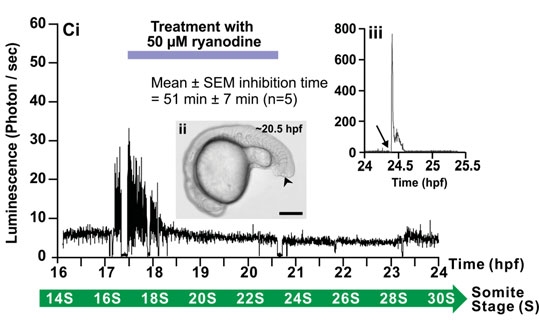
Effect of 2-APB and ryanodine on the trunk Ca2+ signals. Representative temporal profiles of the luminescence generated by ;;alpha;-actin-aeq transgenic embryos that were (Ai) untreated (control; n=9) or treated with (Bi) 25 ;;mu;M 2-APB (n=6) or (Ci) 50 ;;mu;M ryanodine (n=7) for 3 hours as soon as the SP1 Ca2+ signals were observed (i.e., at ~17.5 hpf). Data were plotted every 10 s, with each data point representing 10 sec of accumulated luminescence for an imaging field covering the entire embryo (i.e., ~1.24 mm2) from ~16-17 hpf to 24 hpf (i.e., the ~14- to 30-somite stage). Ca2+ signaling period 1 (SP1), Ca2+ signaling quiet period (QP), and Ca2+ signaling period 2 (SP2), observed in the untreated embryo, are shown. (Aii, Bii, Cii) Bright-field images of the (Aii) untreated, (Bii) 2-APBand (Cii) ryanodine-treated embryos at ~20.5 hpf. The arrowheads in (Bii,Cii) indicate the location of the tail-cut procedure, where ~100 ;;mu;m of the terminal portion of the tail bud was removed. This procedure was performed just prior to incubation with the drugs. Scale bars are 250 ;;mu;m. (Biii,Ciii) Temporal profiles of the luminescence generated at the end of each imaging experiment when triton X-100 was added (see arrows) to the embryos in order to permeabilize the plasma membrane and thus expose any unspent cytoplasmic aequorin to extracellular Ca2+.