
- Title
-
Zebrafish model of tuberous sclerosis complex reveals cell-autonomous and non-cell-autonomous functions of mutant tuberin
- Authors
- Kim, S.H., Speirs, C.K., Solnica-Krezel, L., and Ess, K.C.
- Source
- Full text @ Dis. Model. Mech.
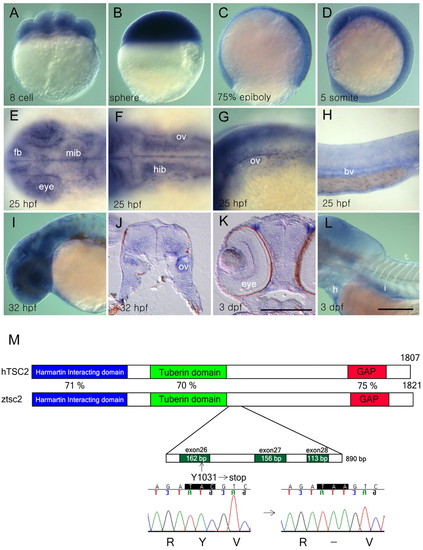
Zebrafish tsc2 is maternally and zygotically expressed during development. (A–D) Ubiquitous expression of wild-type tsc2 at the eight-cell (A), sphere (B), 75% epiboly (C) and five-somite (D) stage. (E–H) At 25 hpf, tsc2 expression is detected in discrete regions of the developing eye and forebrain and midbrain (E), lateral part of the hindbrain (F), otic vesicle (F,G), pharyngeal arch (G), and blood vessels (H). (I) At 32 hpf, tsc2 expression is maintained in the eyes and brain. (J) Transverse section of the hindbrain region shows that tsc2 expression is limited to the ventrolateral region in wild-type embryos. (K,L) At 3 dpf, tsc2 expression is detected in the eye (K), heart and intestine (L). (M) Structure of the predicted protein domains of wild-type human TSC2 and zebrafish tsc2. The vu242 mutation causes a premature stop codon within exon 26. Blue indicates the hamartin-interacting domain, green the tuberin domain and red the GAP domain. fb, forebrain; mib, midbrain; hib, hindbrain; bv, blood vessel; h, heart; i, intestine; ov, otic vesicle. Scale bars: 250 μm (bar in K is for J, K; bar in L is for A–I, L). (A–D,H,I,L) Lateral views; (E,F) dorsal views; anterior to the left. EXPRESSION / LABELING:
|
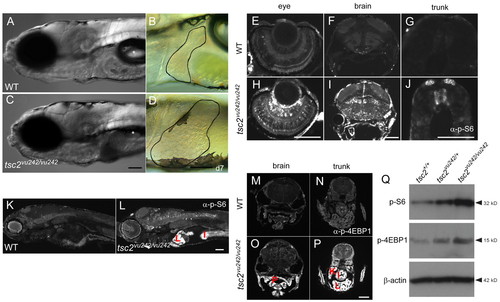
Upregulation of TORC1 activity in various tissues of tsc2vu242/vu242 mutants. (A–D) Homozygous mutant zebrafish have a deflated swim bladder and markedly enlarged liver at 7 dpf. Livers are outlined (B,D); asterisk indicates swim bladder. (E–P) Sections obtained from wild-type (WT) and tsc2vu242/vu242 embryos at 7 dpf and stained with anti-phospho-S6 ribosomal protein (Ser235/236) antibody (E–L) or anti-phospho-4E-BP1 (Thr37/46) (M–P). Phospho-S6 staining in the eye (E,H), brain (F,I) and trunk (G,J). Phospho-4E-BP1 staining in the brain (M,O) and trunk (N,P). (Q) Western blot using anti-phospho-S6 ribosomal protein antibody and anti-phospho-4E-BP1 of total protein lysates from 7-dpf wild-type, tsc2vu242/+ and tsc2vu242/vu242 larvae. Antibody staining for β-actin was used as a loading control. P, pharynx; K, kidney; I, intestine; L, liver. Scale bars: 100 μm. EXPRESSION / LABELING:
PHENOTYPE:
|

Ectopic expression of truncated forms of Tsc2 increases TORC1 activity and causes morphological defects in the brain. (A–D) Lateral view of uninjected wild-type control (A), tsc2 wild-type RNA-injected (B), tsc2vu242 RNA-injected (C) and tsc2/NruI-truncated RNA-injected (D) embryos at the one-somite stage (10.3 hpf). Embryos were labeled with an antibody to phospho-S6 (A–H). (E–H) Dorsal view of A–D. (I–L) Lateral views (anterior to the left) of control (I), tsc2 RNA-injected (J), tsc2vu242 RNA-injected (K) and tsc2/NruI-truncated RNA-injected (L) embryos at 27 hpf. Solid lines mark the hindbrain boundary (I–L). (M) Schematic of constructs used for the production of synthetic RNAs for injection experiments. Scale bars: 100 μm. |
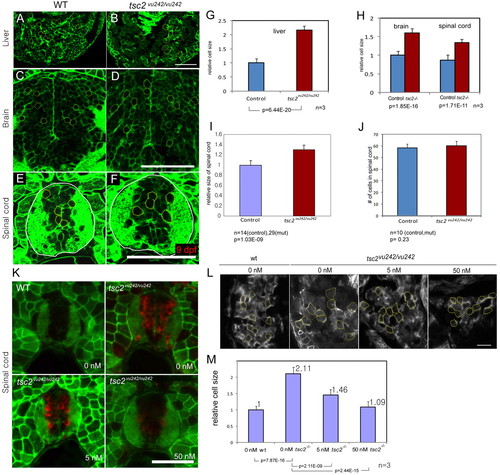
Enlarged hepatocytes and brain and spinal cord neurons in tsc2vu242/vu242 mutant zebrafish and suppression of hepatocyte size by inhibition of TORC1 activity. (A–F) Transverse section of liver (A,B), brain (C,D) and spinal cord (E,F). (G) Hepatocyte size differences in control siblings and tsc2vu242/vu242 mutants are shown. (H) The relative size of neuronal cells in the brain and spinal cord were compared. (I) Homozygous mutant zebrafish have increased size of their spinal cord. (J) Cell number within the spinal cord in control and tsc2vu242/vu242 mutants. (K) Transverse sections through the trunk of 4.5-day-old embryos treated with different concentrations of rapamycin from 3.5 dpf to 4.5 dpf were stained with antibody to phospho-S6 (red). (L) Transverse section of livers from wild-type and tsc2vu242/vu242 mutants without rapamycin treatment, or with 5 nM or 50 nM rapamycin treatment. Cells outlined in yellow were measured and soma size compared. (M) Graph of measurements of relative sizes of cells from embryo shown in L. Numbers on the each bar represent relative cell size. Statistical significance of each analysis is indicated at the bottom of the graph. Scale bars: 50 μm. PHENOTYPE:
|
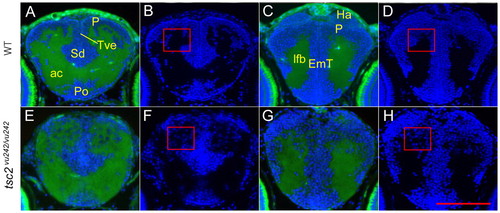
Disruption of the gray and white matter in the anterior forebrain of tsc2vu242/vu242 mutants. Cross-sections through the anterior forebrain of wild-type larvae (A–D) and tsc2vu242/vu242 mutant larvae (E–H) at 7.5 dpf. A restricted telencephalon area containing gray and white matter was analyzed in wild-type (A,B) and tsc2vu242/vu242 mutant (E,F) larvae at 7.5 dpf. (B,F) DAPI-channel-alone image of A and E. The most anterior diencephalon of the wild-type is shown in C and mutant in G, with DAPI channel in D and H. Rectangles in F and H indicate disrupted pallium layers and ectopically mis-positioned cells within the white matter. Green color is tissue autofluorescence; blue is DAPI staining. P, pallium; Po, preoptic region; Sd, dorsal division of subpallium; Tve, telencephalic ventricle; ac, anterior commissure; Ha, habenula; EmT, eminentia thalami; lfb, lateral forebrain bundle. Scale bar: 100 μm. |
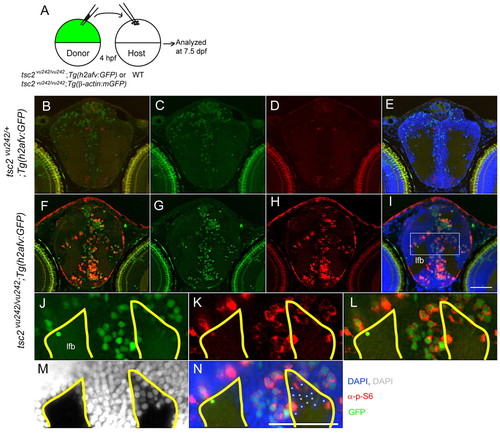
Cell-autonomous activation of TORC1 in tsc2vu242/vu242 mutant cells and non-cell-autonomous disruption of white matter. (A) Schematic of mosaic analyses: cells from wild-type tsc2;Tg(h2afv:GFP) or tsc2vu242/vu242;Tg(h2afv:GFP) donors were transplanted into wild-type host blastulae at 4 hpf, and host embryos were analyzed at 7.5 dpf. (B–L) Coronal brain sections from wild-type embryos receiving either Tg(h2afv:GFP) wild-type donor cells (B–D) or tsc2vu242/vu242; Tg(h2afv:GFP) mutant donor cells (E–L). (C,G) Green (GFP); (D,H) red (phospho-S6); (E,I) green (GFP), red (phospho-S6), blue (DAPI) merged images. (B) Merged image of C and D; (F) merged image of G and H to delineate transplanted cells and those with increased mTORC1 signaling. (J–N) Magnified views of rectangle in I. Asterisks point to wild-type host cells (GFP negative and phospho-S6 negative), which seem to be ectopically positioned within the white matter (M,N). (J–N) The area outlined in yellow marks the normal gray-white matter limits. lfb, lateral forebrain bundle. Scale bars: 50 μm. |
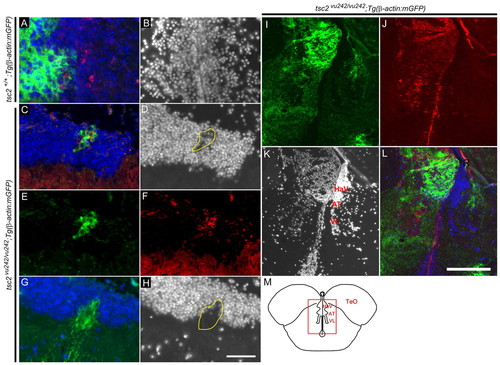
Adult brain abnormalities after tsc2vu242/vu242 mutant cell transplantation. (A–L) Coronal sections of adult brain at 1 year of age. (A) Green (GFP) indicates transplanted wild-type cells, blue (DAPI) shows nuclei and red shows phospho-S6 staining. (B) DAPI channel of A. (C–L) Cell clusters were found 1 year after transplantation in wild-type host zebrafish of tsc2vu242/vu242;Tg(β-actin:mGFP) donor cells. (C,E,G,I,L) Green cells indicate transplanted tsc2vu242/vu242;Tg(β-actin:mGFP) cells. (D,H,K) DAPI staining showing disruption of gray and white matter in wild-type host brain. (C,G) Distance between the two cortical sections shown is 50 μm. (F,J) Red shows phospho-S6 staining. (D,H) Selected areas surrounded by yellow line indicate a disruption of gray and white matter. (C) Merged image of D–F; (L) merged image of I–K. (M) Schematic of brain structure (rectangle) for I–L. TeO, tectum opticum; HaV, ventral habenular nucleus; AT, anterior thalamic nucleus; VL, ventrolateral thalam. Scale bars: 50 μm (A–H); 200 μm (I–L). |
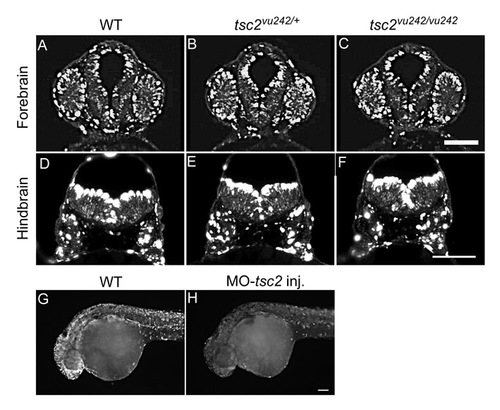
Phosphorylated Tuberin (Ser939) expression in wild-type, tsc2vθ242/+ and tsc2vθ242/vθ242 embryos. Transverse section of forebrain (A-C) and hindbrain (D-F) stained with antibody against phospho-Tuberin (Ser939) at 32 hpf stage. Decreased whole-mount phospho-Tuberin (Ser939) staining in tsc2 morpholino injected embryos (H, 3 ng of MO-tsc2) compared to wild-type control (G, non-injected) embryos. Scale bars equal 100 μm. |

Ectopic overexpression of zebrafish wild-type tsc2 as well as human TSC2 rescues increased TOR activity in tsc2vθ242/vθ242 embryos. Phospho-S6 staining in uninjected control (A,D) and 100 pg of each RNA were injected into tsc2vu242/vu242 embryos (B,C,E,F). Scale bar equals 100 μm. |
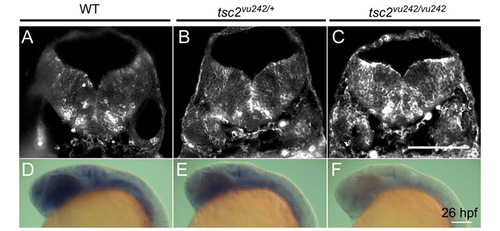
Increased TOR activity and decreased tsc2 mRNA in tsc2vθ242/+ heterozygous and tsc2vθ242/vθ242 homozygous mutant zebrafish. Wild-type (A,D), tsc2vu242/+ heterozygous (B,E) and tsc2vu242/vu242 homozygous embryos at 26 hpf (C,F). Phospho-S6 staining in (A-C), whole mount in situ hybridization staining in (D-F). Scale bar equals 100 μm. |
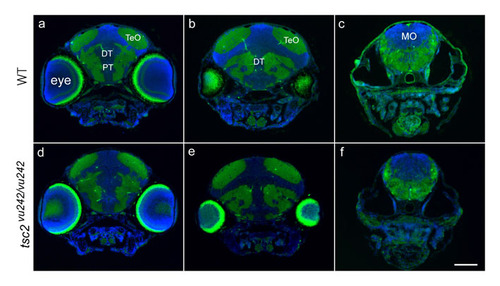
Normal posterior brain morphology in tsc2vθ242/vθ242 mutant zebrafish. Coronal sections through the posterior diencephalon to hindbrain of wild-type embryos (A-C) and tsc2vu242/vu242 mutant embryos (D-F) at 7.5 dpf. Blue staining (DAPI) marks cell nuclei, green is autofluorescence from white matter. TeO, tectum opticum; DT, dorsal thalamus; PT, posterior tuberculum; MO, medulla oblongata. Scale bar equals 100 μm. |

Mild ER stress increases TORC1 signaling in tsc2vθ242/b>+ zebrafish. Wild-type and tsc2vu242/+ siblings were treated with tunicamycin (Tn) (B,C,E,F). Untreated wild-type (A) and tsc2vu242/+ heterozygous zebrafish at 8 dpf (D) had minimal TORC1 activity. Markedly increased TORC1 signaling was seen with 200 ng/ml of Tn tsc2vu242/+ heterozygous zebrafish (E) compared to Tn treated wild-type (B). Treatment of both tsc2vu242/+ heterozygous zebrafish (F) and wild-type (C) zebrafish with 400 ng/ml of Tn led to increased TORC1 signaling evidenced by phospho-S6 (Ser235/236) staining. L, liver. Scale bar equals 100 μm. |

Unillustrated author statements PHENOTYPE:
|