
Fig. 7
- ID
- ZDB-FIG-110407-17
- Publication
- Kim et al., 2011 - Zebrafish model of tuberous sclerosis complex reveals cell-autonomous and non-cell-autonomous functions of mutant tuberin
- Other Figures
- All Figure Page
- Back to All Figure Page
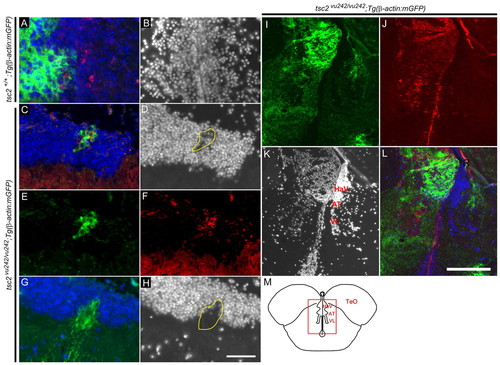
Adult brain abnormalities after tsc2vu242/vu242 mutant cell transplantation. (A–L) Coronal sections of adult brain at 1 year of age. (A) Green (GFP) indicates transplanted wild-type cells, blue (DAPI) shows nuclei and red shows phospho-S6 staining. (B) DAPI channel of A. (C–L) Cell clusters were found 1 year after transplantation in wild-type host zebrafish of tsc2vu242/vu242;Tg(β-actin:mGFP) donor cells. (C,E,G,I,L) Green cells indicate transplanted tsc2vu242/vu242;Tg(β-actin:mGFP) cells. (D,H,K) DAPI staining showing disruption of gray and white matter in wild-type host brain. (C,G) Distance between the two cortical sections shown is 50 μm. (F,J) Red shows phospho-S6 staining. (D,H) Selected areas surrounded by yellow line indicate a disruption of gray and white matter. (C) Merged image of D–F; (L) merged image of I–K. (M) Schematic of brain structure (rectangle) for I–L. TeO, tectum opticum; HaV, ventral habenular nucleus; AT, anterior thalamic nucleus; VL, ventrolateral thalam. Scale bars: 50 μm (A–H); 200 μm (I–L). |