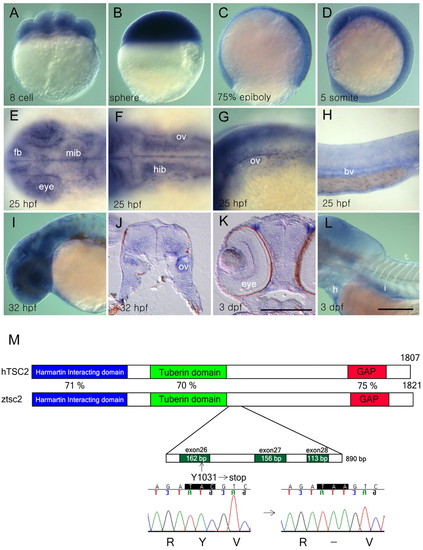
Zebrafish tsc2 is maternally and zygotically expressed during development. (A–D) Ubiquitous expression of wild-type tsc2 at the eight-cell (A), sphere (B), 75% epiboly (C) and five-somite (D) stage. (E–H) At 25 hpf, tsc2 expression is detected in discrete regions of the developing eye and forebrain and midbrain (E), lateral part of the hindbrain (F), otic vesicle (F,G), pharyngeal arch (G), and blood vessels (H). (I) At 32 hpf, tsc2 expression is maintained in the eyes and brain. (J) Transverse section of the hindbrain region shows that tsc2 expression is limited to the ventrolateral region in wild-type embryos. (K,L) At 3 dpf, tsc2 expression is detected in the eye (K), heart and intestine (L). (M) Structure of the predicted protein domains of wild-type human TSC2 and zebrafish tsc2. The vu242 mutation causes a premature stop codon within exon 26. Blue indicates the hamartin-interacting domain, green the tuberin domain and red the GAP domain. fb, forebrain; mib, midbrain; hib, hindbrain; bv, blood vessel; h, heart; i, intestine; ov, otic vesicle. Scale bars: 250 μm (bar in K is for J, K; bar in L is for A–I, L). (A–D,H,I,L) Lateral views; (E,F) dorsal views; anterior to the left.
|
