
Fig. 6
- ID
- ZDB-IMAGE-110407-16
- Publication
- Kim et al., 2011 - Zebrafish model of tuberous sclerosis complex reveals cell-autonomous and non-cell-autonomous functions of mutant tuberin
- All Figures
- Figures for Kim et al., 2011
|
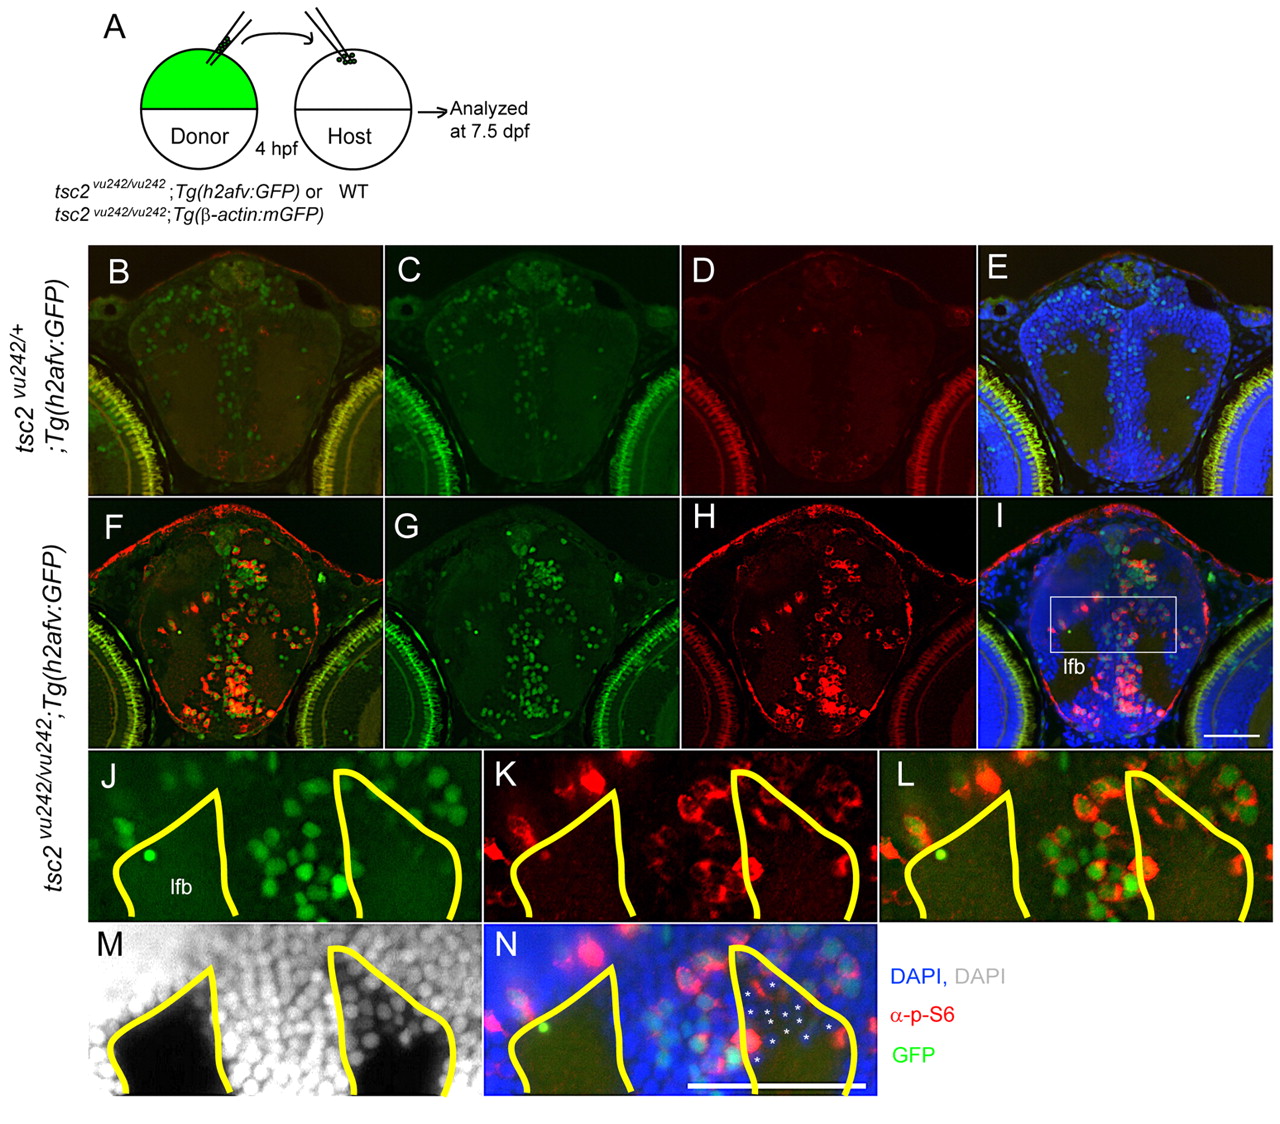
Fig. 6 Cell-autonomous activation of TORC1 in tsc2vu242/vu242 mutant cells and non-cell-autonomous disruption of white matter. (A) Schematic of mosaic analyses: cells from wild-type tsc2;Tg(h2afv:GFP) or tsc2vu242/vu242;Tg(h2afv:GFP) donors were transplanted into wild-type host blastulae at 4 hpf, and host embryos were analyzed at 7.5 dpf. (B–L) Coronal brain sections from wild-type embryos receiving either Tg(h2afv:GFP) wild-type donor cells (B–D) or tsc2vu242/vu242; Tg(h2afv:GFP) mutant donor cells (E–L). (C,G) Green (GFP); (D,H) red (phospho-S6); (E,I) green (GFP), red (phospho-S6), blue (DAPI) merged images. (B) Merged image of C and D; (F) merged image of G and H to delineate transplanted cells and those with increased mTORC1 signaling. (J–N) Magnified views of rectangle in I. Asterisks point to wild-type host cells (GFP negative and phospho-S6 negative), which seem to be ectopically positioned within the white matter (M,N). (J–N) The area outlined in yellow marks the normal gray-white matter limits. lfb, lateral forebrain bundle. Scale bars: 50 μm.