
- Title
-
Spermatogonial stem cell niche and spermatogonial stem cell transplantation in zebrafish
- Authors
- Nóbrega, R.H., Greebe, C.D., van de Kant, H., Bogerd, J., de França, L.R., and Schulz, R.W.
- Source
- Full text @ PLoS One

Topographical distribution of type A undifferentiated spermatogonia in zebrafish testes. A. Quantification of type A undifferentiated spermatogonia as located near the interstitium or in the intertubular area. Note that ~76% of type A undifferentiated spermatogonia are preferentially located near the interstitium. B. Tubular perimeter of the regions contacting the interstitium or intertubular areas. A,B. Bars represent the mean ± SE which are expressed as percentage. Different letters mean significant differences among the groups. C,D. Histological sections of the zebrafish seminiferous tubules. Note that most of type A undifferentiated spermatogonia (arrowheads) are distributed near the (yellow) interstitium. Staining: PAS (Periodic Acid Schiff)/Ferric Hematoxylin/Metanil Yellow. Scale bar = 10 μm. E. Relative number of type Aund* and Aund in normal (n = 7) and busulfan-depleted testes (n = 10). Bars represent the percentage mean ± SE of 100–200 type A spermatogonia, significant differences among the groups (p<0.05) are indicated by an asterisk. |
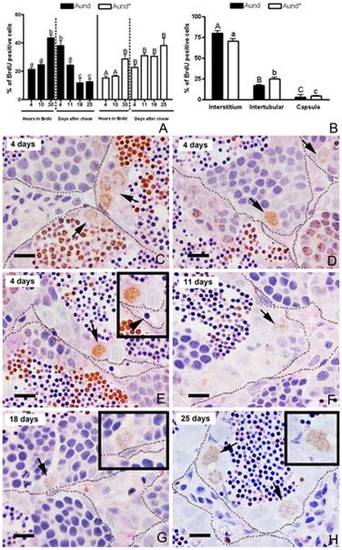
Label retaining cell (LRC) approach in zebrafish testes. A. BrdU labeling index of type Aund* and Aund during BrdU exposure (4, 10, and 30 h) and after 4, 11, 18 and 25 days of chase. Bars represent the percentage mean ± SE (n = 5); different letters denote significant differences (p<0.05) in time. B. Distribution of BrdU-positive Aund* and Aund spermatogonia after 18 and 25 days of chase. Bars represent the mean ± SE which are expressed as percentage, and different letters indicate significant differences (p<0.05) among the groups. C–H. BrdU immunodetection with PAS staining after 4 (C–E), 11 (F), 18 (G), and 25 (H) days of chase. Note that BrdU immunostaining is diluted as a consequence of the progression of spermatogenesis. Only the slow-cycling cells (stem cells candidates) are able to retain the BrdU label for long periods of time. LRCs are indicated by arrows. Some of LRC are near to blood vessels (arrowhead) (E). Insets are high magnification of the LRCs (type A undifferentiated spermatogonia). The interstitium is delimited by spotted lines. Scale bars = 10 μm. |
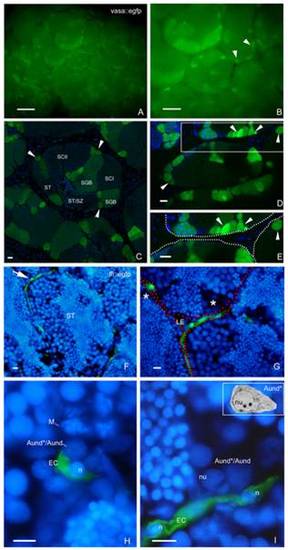
SSC niche in zebrafish testes. Whole-mount of vasa::egfp testes analyzed under fluorescence (A,B) and CLSM (C–E). A,B. Most of the brightest and small spots (type A undifferentiated spermatogonia) (arrowheads) are adjacent the triangle/lozenge dark areas (interstitium). Scale bars = 0.1 mm and 0.5 mm, respectively. C–E. Vasa is highly expressed in type A undifferentiated spermatogonia, and is gradually decreased during the spermatogenesis. Aund*/Aund (arrowheads), type B spermatogonia (SGB), primary spermatocytes (SCI), secondary spermatocytes (SCII), spermatids (ST), spermatids and spermatozoa (ST/SZ). Note that most of Aund*/Aund (arrowheads) are situated near the interstitium (D, dark areas; E, delimited by spotted lines). E is a high magnification of the square in D. Scale bars = 10 μm. F–I: Cryosections of fli::egfp testes stained with DAPI (nuclear staining) and analyzed under fluorescence microscopy. The arrow in F shows a blood vessel (green) surrounding the circumference of a seminiferous tubule (ST). Interstitium (delimited with red dotted lines), Leydig cells (LE) and group of type A spermatogonia (asterisks) are shown in G. H,I. Aund*/Aund are near the endothelial cell (EC) nuclei (n). Note a metaphase figure (M) in H. Nucleolus (nu) of type A undifferentiated spermatogonia is shown in I. Compare the similar morphology of Aund* (inset) with the cells found near the endothelial cell. Scale bars = 10 μm. EXPRESSION / LABELING:
|
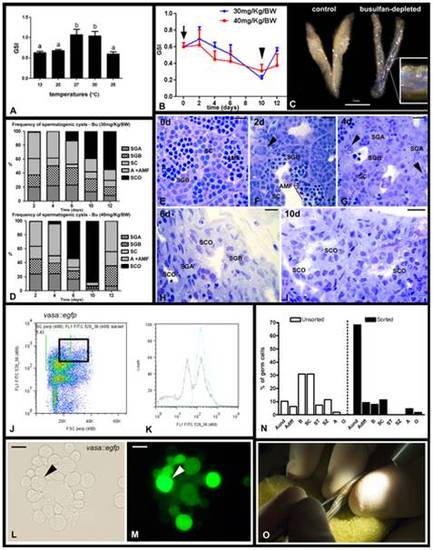
Depletion of endogenous spermatogenesis in male recipients for SSC transplantation. A. Effects of different temperatures on zebrafish GSI (gonadosomatic index). Bars represent mean ± SE (n = 15, 20°C), (n = 12, 27°C), (n = 7, 30°C), and (n = 12, 35°C). Different letters indicate significant differences (p<0.05) among groups. B. Effects of two single doses of busulfan (30 or 40 mg/Kg) on zebrafish GSI. The arrow indicates the day of injection (day 0), the arrowhead shows that the lowest GSI is observed 10 days after injection. Dots represent mean±SE (n = 6). C. Testes from control (27°C, left) and busulfan-depleted animals. Inset shows a high magnification of the depleted testis after in vivo injection via the urogenital pore of a solution containing trypan blue. D. Frequency of spermatogenic cysts after a single dose of 30 or 40 mg/Kg busulfan. Type A spermatogonia (SGA), type B spermatogonia (SGB), spermatocytes (SC), apoptosis and abnormal metaphase I figures (A+AMF), Sertoli cell only (SCO). Bars represent means expressed as percentage. E–I. Histological sections of testes collected at 0 (E), 2 (F), 4 (G), 6 (H), and 10 (I) days after a single injection of 40 mg/Kg busulfan at 35°C. Note that busulfan induced spermatogonial apoptosis (arrowheads) after 4 days of injection. Scale bars = 10 μm. J. Testicular cell suspensions were obtained from vasa::egfp testes and subjected to FACS. Dot plot shows the total testicular suspension from which a population of large cells (forward scatter, FSC; abscissa), showing an intense fluorescence (FL1 FITC; ordinate) was sorted (black square). K. Histogram shows an enrichment of the sorted cells after FACS. Blue line (sorted cells), black line (total testicular cell suspension). FL1 FITC (x axis) means intensity of fluorescence, and counts (y axis), the number of events. L,M. Fraction of sorted cells under normal light (L) and under fluorescence (M). Arrow indicates a large cell carrying high fluorescence. Scale bars = 10 μm. N. Histogram showing the percentage of germ cells in the unsorted and sorted fractions. Despite of the contamination with other germ cell types (cell clumping before FACS), there is an enrichment of type A undifferentiated spermatogonia (Aund*/Aund) population, which might contain SSC candidates. Undifferentiated type A spermatogonia (Aund* and Aund), differentiating type A spermatogonia (Adiff), type B spermatogonia, spermatocytes (SC), spermatids (ST), spermatozoa (SZ), apoptosis (A) and others (O). Bars represent means expressed as percentage. O. Germ cell transplantation into zebrafish genital pore using a glass capillary needle. |

SSC transplantation into male zebrafish recipients. A,B. Recipient testes after two weeks (2w) of transplantation analyzed by light (A) and fluorescence (B) microscopies. Seminiferous tubules are delimited by stippled lines. Arrows indicate the same area in A and B. Donor cells formed clusters situated near the interstitium in a similar way as observed in vasa::egfp testes (see arrowheads in the inset). Nuclei (blue) are stained with DAPI. Scale bars = 50 μm. C,D. CLSM analysis of recipient testes after two weeks (2w) of transplantation. Arrowheads indicate a donor-derived cyst composed of ~8 cells. Inset. High magnification of donor-derived cyst. Nuclei (blue) are stained with DAPI. E,F. Recipient testes after 3 weeks (3w) of transplantation analyzed under CLSM. Donor-derived cysts increased their number and size, being found at different stages of spermatogenesis. Type A undifferentiated spermatogonia (Aund*/Aund), type A differentiating spermatogonia (Adiff), type B spermatogonia (B), and spermatocytes (SC). Inset shows a high magnification of type A undifferentiated spermatogonia. Nuclei (blue) are stained with DAPI. |
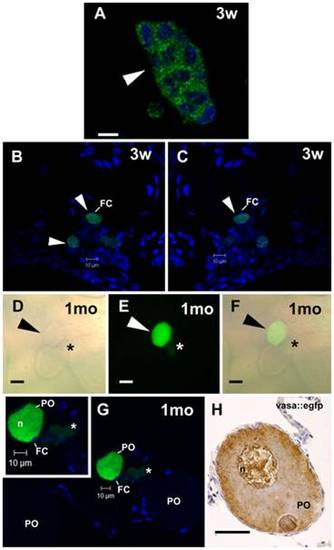
SSC transplantation into female zebrafish recipients analyzed under CLSM. A. A GFP cell cluster-derived from transplanted SSC after three weeks (3w) of transplantation. Nuclei (blue) are stained with DAPI. Scale bar = 10 μm. B,C. Arrowhead indicates an early donor-derived oocytes surrounded by follicle cells (FC) after three weeks (3w) of transplantation. Nuclei (blue) are stained with DAPI. D–F. Arrowhead indicates an advanced GFP oocyte, which was originated from transplanted SSC into zebrafish ovaries after one month (1mo) of transplantation. Note a small GFP cell cluster (asterisk) near the donor-derived oocyte. Light (D) and fluorescence (E) microscopies, and overlay of both (F). Scale bars = 25 μm. G. The same oocyte in D–F examined under CLSM. A green donor-derived perinucleolar oocyte (PO), endogenous perinucleolar oocyte (PO), small GFP cell cluster (asterisk), and nucleus (n) are shown. Inset. High magnification of advanced donor-derived oocyte. Nuclei (blue) are stained with DAPI. H. Perinucleolar oocyte from vasa::egfp ovaries immunostained for gfp. Compare similar vasa expression pattern between donor-derived oocyte and perinucleolar oocyte from vasa::egfp ovaries. Scale bar = 25 μm. |
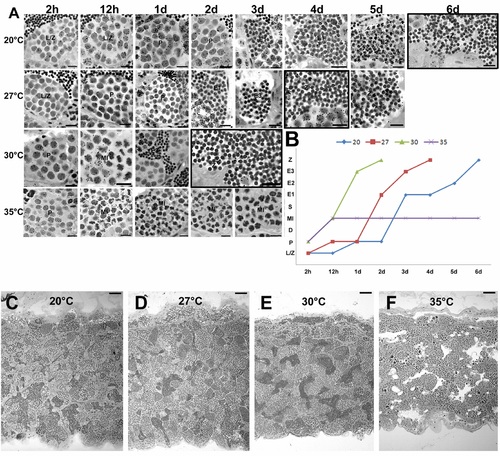
Effects of different temperatures on zebrafish spermatogenesis. A. More advanced labeled germ cell after 2 h, 12 h, 1d, 2d, 3d, 4d, 5d, 6d of 3H-thymidine injection in zebrafish males kept at 20°C, 27°C, 30°C, and 35°C. Leptotene/zygotene (L/Z) and pachytene (P) spermatocytes, metaphase I (MI), initial spermatids (E1), intermediate spermatids (E2), final spermatids (E3) and spermatozoa (Z). Scale bars = 10 μm. Cells were considered labeled when four to five or more grains were present over the nucleus in the presence of low-to-moderate background (i.e., very few grains per histological field observed under oil immersion). Black squares indicate the time in which labeled spermatozoa were found in the lumen of zebrafish testes at different temperatures. B. Histogram showing the combined duration of meiotic and spermiogenic phases at different temperatures. Spermatogenesis did not progress beyond the first meiotic division at 35°C. X axis represents the time, whereas y axis the 3H-thymidine labeled germ cell [Leptotene/zygotene (L/Z), pachytene (P) and diplotene (D) spermatocytes, metaphase I (MI), initial spermatids (E1), intermediate spermatids (E2), final spermatids (E3) and spermatozoa (Z)]. C–E. Histological sections of zebrafish testes at 27°C, 30°C, and 35°C. Sperm free and a massive germ cell apoptosis is seen in zebrafish seminiferous tubules at 35°C. Scale bars = 50 μm. |
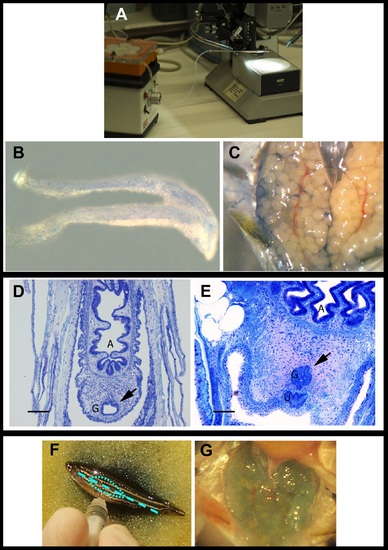
Standardization of SSC transplantation techniques. A. Transplantation device, in which a glass capillary needle is coupled to a peristaltic pump. B,C. Standardization of transplantation via using trypan blue to monitor the efficiency of the injections. Note trypan blue inside the testis (B) and ovaries (C). D,E. Genital pore histological sections stained with toluidine blue (male - D, female - E). Genital pore measurements: 120×80 µm dimensions, 63° angle (female); 75×50 μm dimensions, 60° angle (male). Anus (A), genital pore (G, arrow), and urethra (U). Scale bars = 100 µm. F. Ovary cell transplantation throughout injections into the lateral body wall (indicated by stippled line). G. Trypan blue was used to monitor the specificity of the injection. Note trypan blue inside the ovaries. |
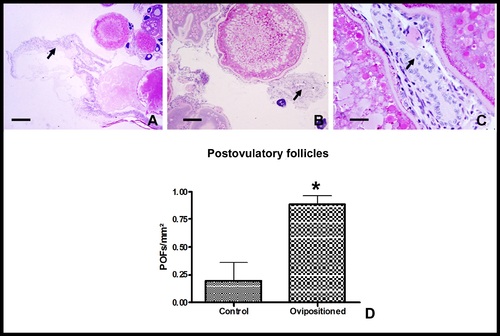
Preparation of female zebrafish recipients for SSC transplantation. A–C. Ovaries histological sections of ovoposition-induced females stained with PAS (Periodic acid Schiff). Arrows indicate postovulatory follicles after ovoposition. Note in C the available follicle cells which can support the transplanted SSC development. Scales bars = 250 μm (A), 100 μm (B), 25 μm (C). D. Number of postovulatory follicles (POFs)/mm2 of ovary in control (n = 5) and ovopositioned females (n = 5). Bars represent the mean± SE. * means significant differences (p<0.05) between the groups (Student unpaired t-test). |

Vasa expression pattern during male germ cell development using gfp immunodetection in sections of vasa::egfp testes (A), or vasa immunodetection in cryosections of wild-type testes (B). Type A undifferentiated spermatogonia (Aund*/Aund), type A differentiating spermatogonia (Adiff), type B spermatogonia (B), spermatocytes (SC), spermatids (ST), spermatozoa (SZ). Scale bars = 25 μm (A) and 10 μm (B). EXPRESSION / LABELING:
|

PCR analysis for GFP detection using primers located in the YFP gene, 2% agarose gel containing ethidium bromide, showing the detection of a faint background band. A. vasa::egfp testes were used as a positive control. Transplanted male after 3 weeks of transplantation, transplanted female after 1 month of transplantation, H2O water as negative control. Bands at left side are DNA markers from SMART ladder (Eurogentec). B. PCR detection using primers located in the PD-ECGF (plated-derived endothelial cell growth factor) gene as positive control for genomic DNA in the different individuals, 2% agarose gel containing ethidium bromide, showing the detection of a faint background band. Bands at left side are DNA markers from SMART ladder. |