
- Title
-
Calycosin Promotes Angiogenesis Involving Estrogen Receptor and Mitogen-Activated Protein Kinase (MAPK) Signaling Pathway in Zebrafish and HUVEC
- Authors
- Tang, J.Y., Li, S., Li, Z.H., Zhang, Z.J., Hu, G., Cheang, L.C., Alex, D., Hoi, M.P., Kwan, Y.W., Chan, S.W., Leung, G.P., and Lee, S.M.
- Source
- Full text @ PLoS One
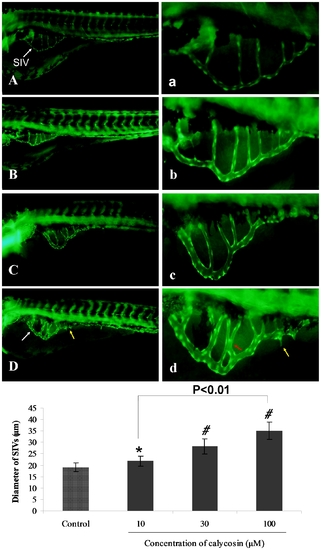
The effects of calycosin treatment on blood vessel formation in SIVs of Tg(fli1:EGFP) zebrafish embryos. (A) Control: embryo treated with 0.1% DMSO at 96 hpf, SIVs appear as a smooth basket-like structure. (B–D) Calycosin: embryo treated with 10, 30, 100 μM calycosin at 72 hpf for 24 h, leads to enlarged SIV basket stretching into the posterior yolk extension. (a–d) Enlarged SIV region (x4.5) of A–D respectively. White arrows indicating the enlarged vessels, yellow and red arrows indicate sprouting and intersectioning branches respectively. (E) Calycosin increases SIV diameter in a dose-dependent manner. Data are plotted as mean±SEM, (n = 3), *P<0.05, #P<0.001. |
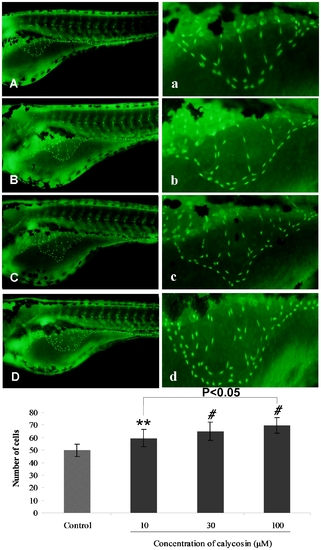
The effects of calycosin on endothelial cells population in SIVs of Tg(fli1:nEGFP) zebrafish embryos. Each green light point represents one endothelial cell (GFP+). (A) Control: embryo treated with 0.1% DMSO at 96 hpf. (B–D) Calycosin: embryo treated with 10, 30, 100 μM calycosin at 72 hpf for 24 h, leads to an increase in endothelial cells. (a–d) Enlarged SIV region (x4.5) of A–D respectively. (E) Calycosin increases the number of endothelial cells in the SIV region in a dose-dependent manner. Data are plotted as mean±SEM, (n = 3), **P<0.01, #P<0.001. |
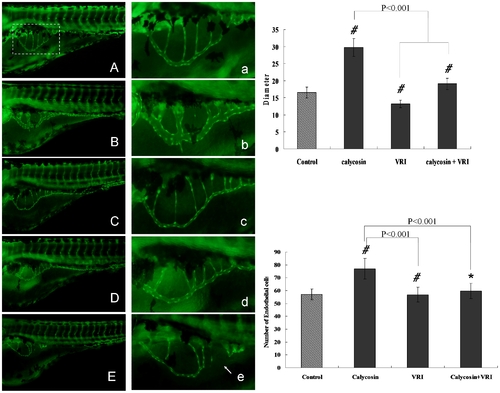
The effects of VEGFR tyrosine kinase inhibitor on calycosin-induced angiogenesis in zebrafish embryos. (A) Control: embryo treated with 0.1% DMSO at 96 hpf. (B) Calycosin: embryo treated with calycosin (100 μM) at 72 hpf for 24 h. (C & E) VRI: embryo treated with low concentration (100 ng/ml, C) and high concentration (1 μg/ml, E) of VRI at 72 hpf for 24 h. (D) VRI and calycosin: embryo treated with both VRI (100 ng/ml) and calycosin (100 μM) at 72 hpf for 24 h. (a–e) Enlarged SIV region (x4.5) of A–E respectively. (F) Effects of calycosin and/or VRI on the diameter of SIV compared with the control group. Data are plotted as mean±SEM, (n = 3), #P<0.0001. (G) Effects of calycosin and/or VRI on the number of endothelial cells in SIV region compared with the control group. Data are plotted as mean±SEM, (n = 3), *P<0.05, #P<0.001. |
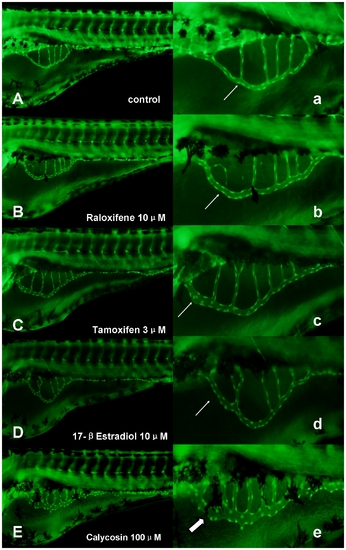
The effects of calycosin, raloxifene and tamoxifen in SIVs of Tg(fli1:EGFP). (A) Controls: were treated with 0.1% DMSO at 96 hpf, showing no effect on vessel formation (B–E) were treated with 10 μM raloxifene, 3 μM tamoxifen, 10 μM 17-β-Estradiol and 100 μM calycosin at 72 hpf for 24 h. (a–e) Enlarged SIV region (x4.5) of A–E respectively. Abnormal phenotype of blood vessel formation in SIVs was indicated by white arrow, showing slight increase in vessel diameter. Significant increase in vessel diameter was indicated by thick white arrow. |
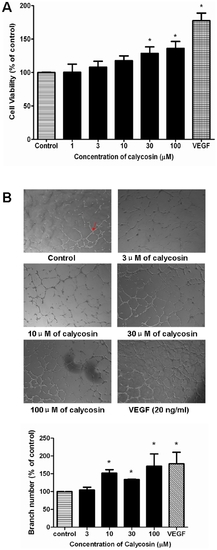
The effects of calycosin on HUVECs in vitro. (A) Effects of calycosin on proliferation of HUVEC by XTT assay. HUVECs were seeded in 96-well plates and incubated with calycosin at different concentrations. Cell proliferation was assessed using XTT assay; (B) Tube formation of calycosin-treated HUVECs on Matrigel. HUVECs cultured on 3-dimensional Matrigel in treatment of calycosin (3 μM, 10 μM, 30 μM and 100 μM). Cells receiving 0.1% DMSO served as vehicle control. Number of branching points in different concentrations of calycosin-treated HUVECs was calculated by computer software (Metamorph). Results are expressed as percentage of control (100%) in mean±SEM (n≥3 independent experiments), *P<0.05 versus control. |
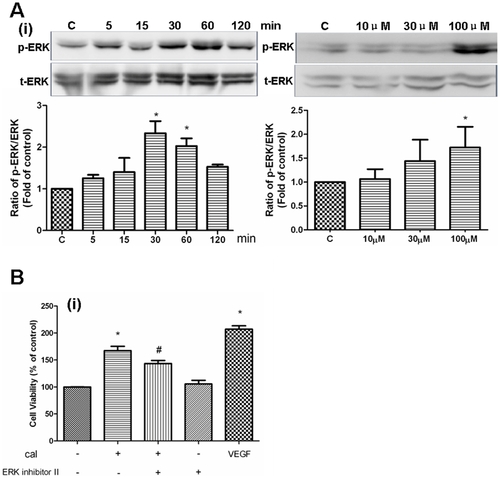
Role of MAPK signaling in calycosin-induced angiogenesis. (A) Effects of calycosin on ERK1/2 activation. HUVEC were incubated with calycosin (100 μM) at indicated time or with calycosin in different concentrations for 30 min. Expressions of phospho-ERK1/2 and total-ERK1/2 were analyzed by western blotting and quantified by densitometry. The values indicate the relative densitometric units. Results are represented as mean±SEM (n = 3 independent experiments), * P<0.05 versus control. (B) Effect of ERK activation inhibitor peptide II on calycosin-induced HUVEC proliferation. HUVECs were pre-treated with 0.5 μM ERK activation inhibitor peptide II (ERK inhibitor II) for 1 h before the addition of calycosin (100 μM). Changes in HUVEC proliferation were determined 48 h later by XTT assay. 20 ng/ml VEGF was used as the positive control in this experiment. “cal” is the abbreviation of calycosin. Results are expressed as percentage of vehicle control (100%) in mean±SEM (n≥3 independent experiments), *P<0.05 versus vehicle control, # P<0.05 versus calycosin. |
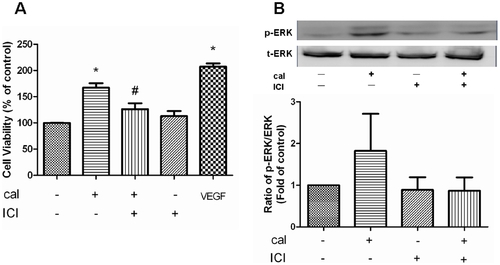
Role of ER in calycosin-induced angiogenesis. (A) Effects of ICI182, 780 on calycosin-induced HUVEC proliferation. HUVECs were pre-treated with ICI182, 780 (30 μM) before the addition of calycosin (100 μM). Data are expressed as percentage of vehicle control (100%) in mean±SEM (n = 3 independent experiments), *P<0.05 versus control, #P<0.05 versus calycosin. (B) Effect of ICI182, 780 on calycosin-induced activation of ERK1/2. Calycosin-stimulated phosphorylation of ERK1/2 was completely reversed by the absence of ICI182, 780 (30 μM). Expression of phospho-ERK1/2 and total-ERK1/2 was analyzed by western blotting and quantified by densitometry. The values indicate the relative densitometric units of the p-ERK1/2 bands with the density of the control band set arbitrarily at 1.0. Results are represented as mean±SEM. “cal” and “ICI” are the abbreviations of calycosin and ICI182, 780 respectively. |