
Image
|
Figure Caption
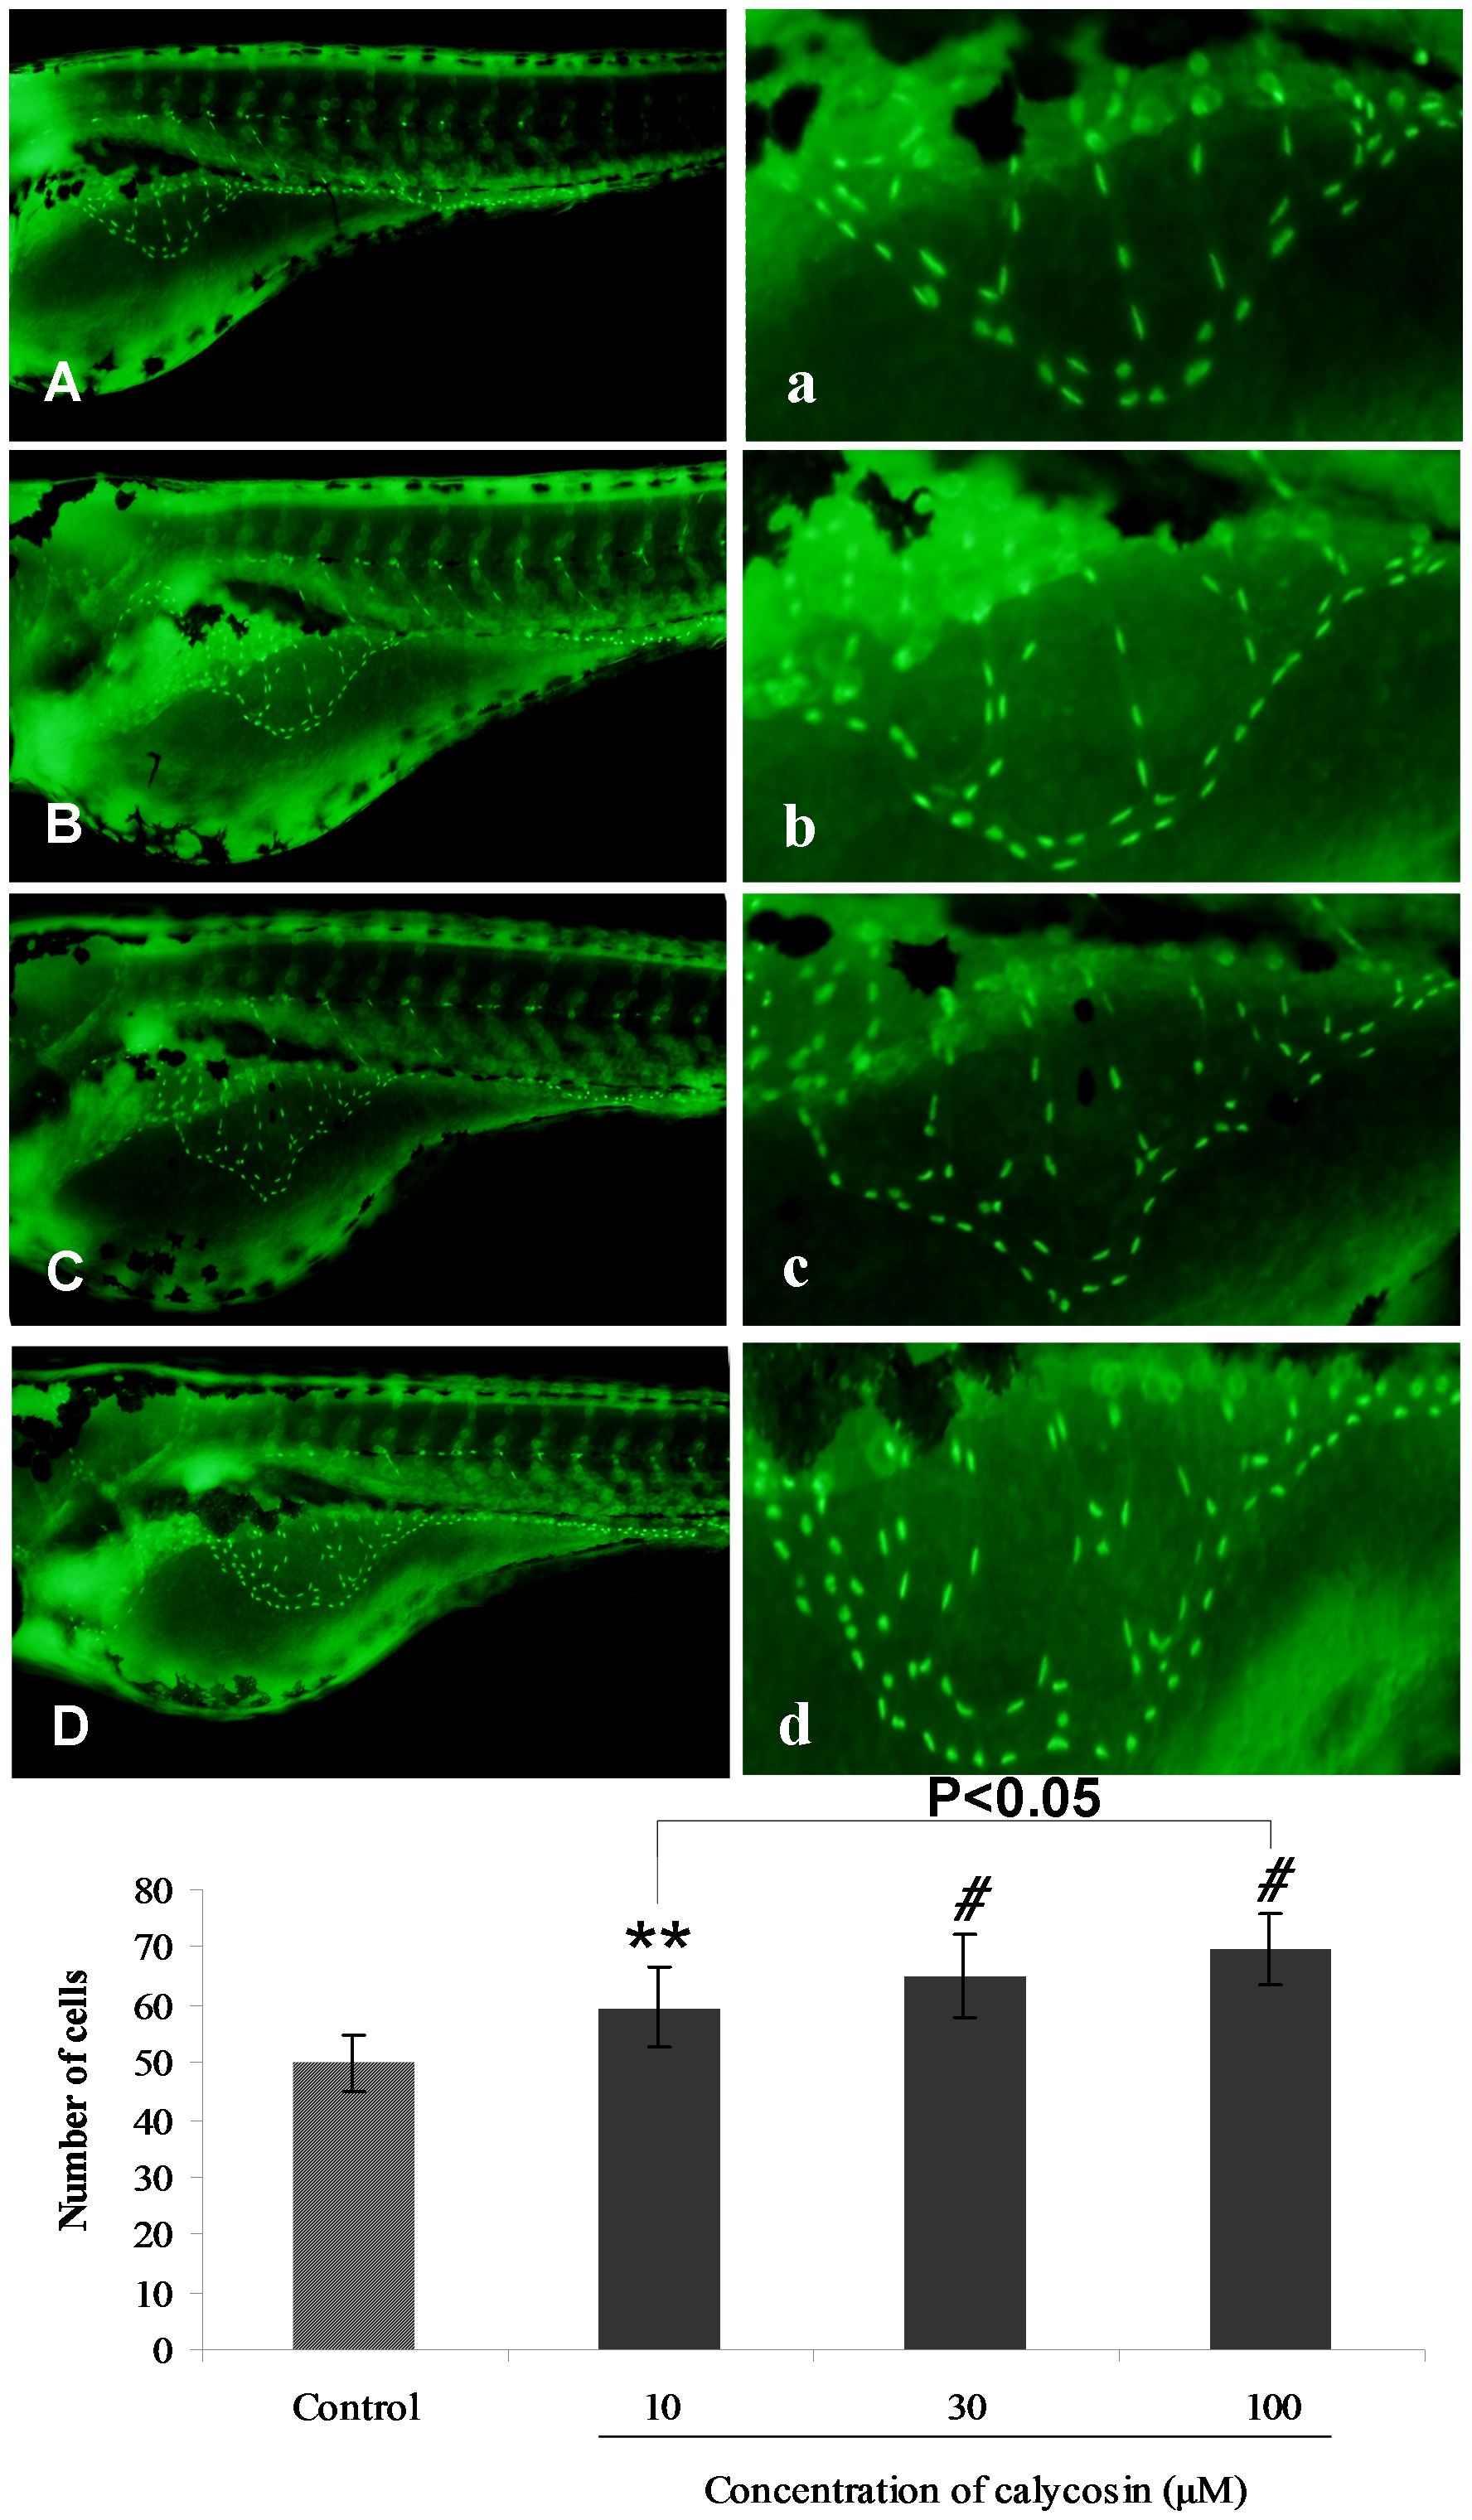
Fig. 2 The effects of calycosin on endothelial cells population in SIVs of Tg(fli1:nEGFP) zebrafish embryos.
Each green light point represents one endothelial cell (GFP+). (A) Control: embryo treated with 0.1% DMSO at 96 hpf. (B–D) Calycosin: embryo treated with 10, 30, 100 μM calycosin at 72 hpf for 24 h, leads to an increase in endothelial cells. (a–d) Enlarged SIV region (x4.5) of A–D respectively. (E) Calycosin increases the number of endothelial cells in the SIV region in a dose-dependent manner. Data are plotted as mean±SEM, (n = 3), **P<0.01, #P<0.001.
Acknowledgments
This image is the copyrighted work of the attributed author or publisher, and
ZFIN has permission only to display this image to its users.
Additional permissions should be obtained from the applicable author or publisher of the image.
Full text @ PLoS One