
|
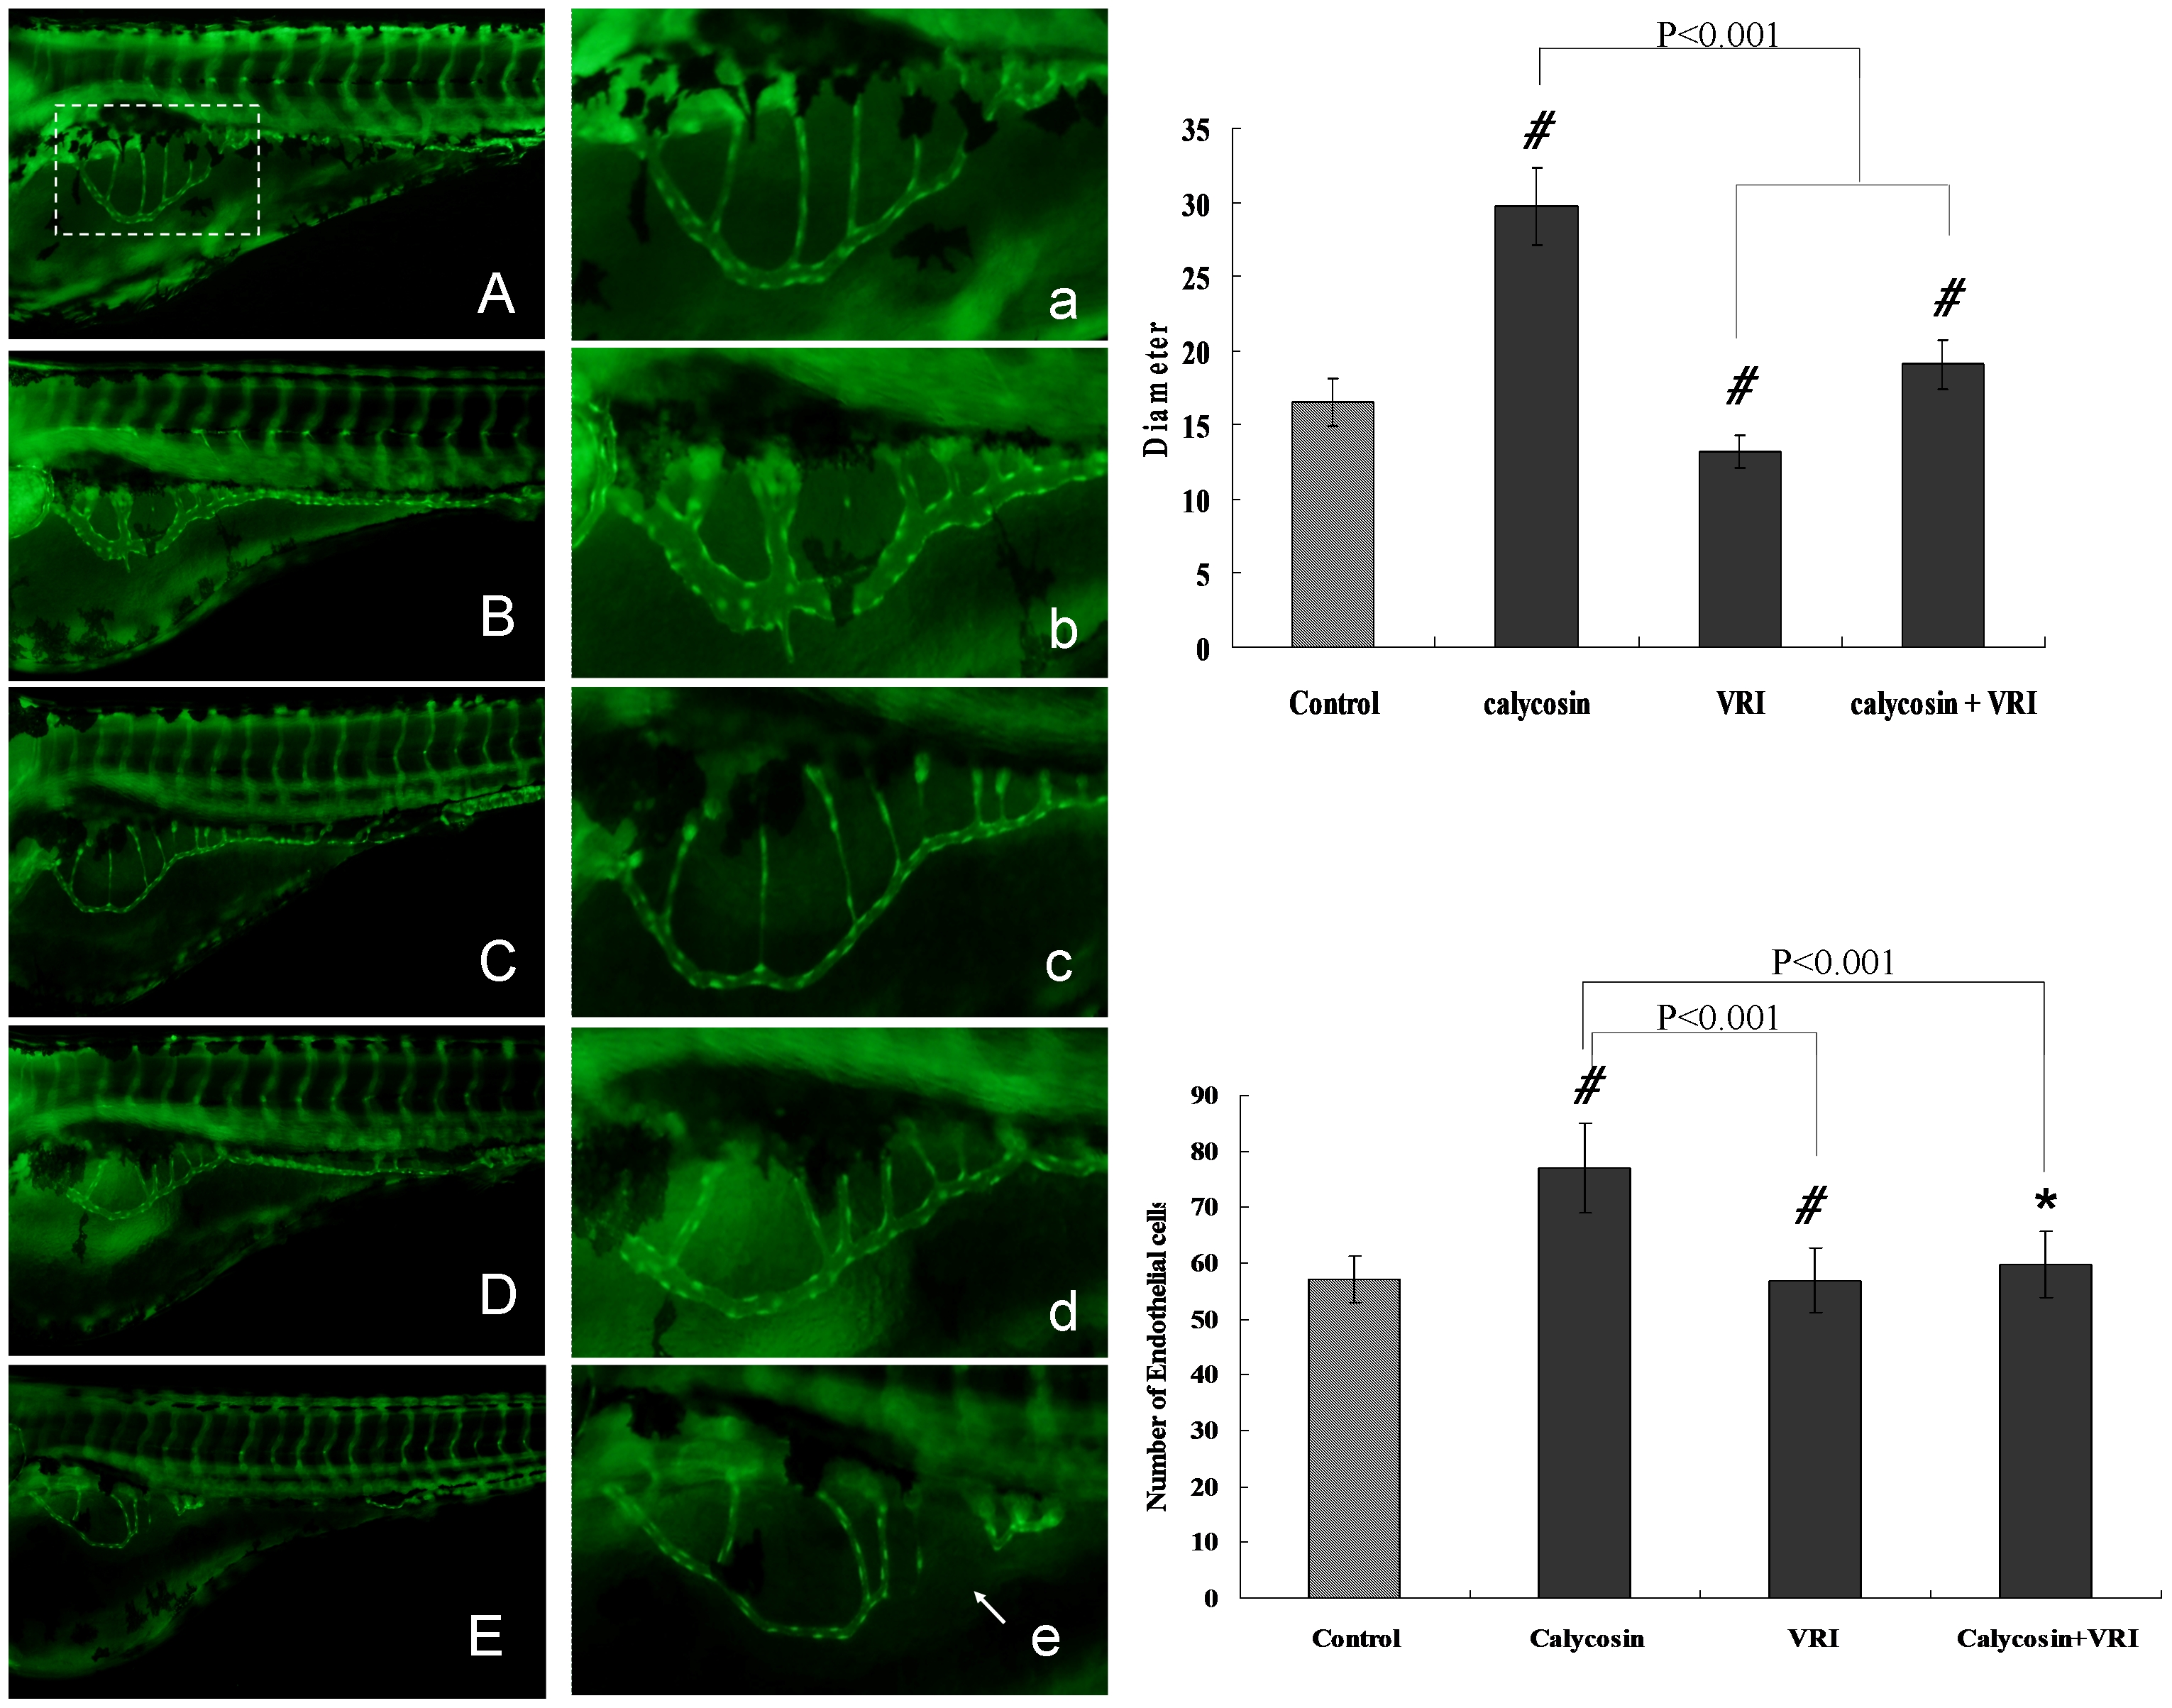
Fig. 4 The effects of VEGFR tyrosine kinase inhibitor on calycosin-induced angiogenesis in zebrafish embryos.
(A) Control: embryo treated with 0.1% DMSO at 96 hpf. (B) Calycosin: embryo treated with calycosin (100 μM) at 72 hpf for 24 h. (C & E) VRI: embryo treated with low concentration (100 ng/ml, C) and high concentration (1 μg/ml, E) of VRI at 72 hpf for 24 h. (D) VRI and calycosin: embryo treated with both VRI (100 ng/ml) and calycosin (100 μM) at 72 hpf for 24 h. (a–e) Enlarged SIV region (x4.5) of A–E respectively. (F) Effects of calycosin and/or VRI on the diameter of SIV compared with the control group. Data are plotted as mean±SEM, (n = 3), #P<0.0001. (G) Effects of calycosin and/or VRI on the number of endothelial cells in SIV region compared with the control group. Data are plotted as mean±SEM, (n = 3), *P<0.05, #P<0.001.