
- Title
-
Expression of two insm1-like genes in the developing zebrafish nervous system
- Authors
- Lukowski, C.M., Ritzel, R.G., and Waskiewicz, A.J.
- Source
- Full text @ Gene Expr. Patterns

Comparison of zebrafish Insm1a and Insm1b to mammalian and invertebrate homologues. (A) Amino acid alignment of predicted zebrafish Insm1a (AAZ94623) and Insm1b (AAZ94624) to human (NP_002187) and mouse (NP_058585) INSM1. Amino acid identity (asterisks) and similarity (periods) are indicated below the aligned sequences. Insm1 is predicted to contain an amino-terminal SNAG motif (blue), a putative nuclear localization sequence (green), and five (numbered) carboxy-terminal Cys2-His2 zinc fingers (red). Zinc coordination residues of each zinc finger are highlighted in red. (B) Protein schematic showing the predicted domain structure of Insm1, Nerfin-1, and EGL-46 proteins. Shown are the amino-terminal SNAG repressor domains (blue), putative nuclear localization signals (green) and carboxy-terminal Cys2-His2 zinc fingers (red). Proteins were drawn to scale and aligned about the highly conserved EIN domain. Zinc fingers are numbered based on homology as in (A) and indicated in invertebrate homologues. Zinc finger 3 of EGL-46 (asterisk) does not share the conservation seen in other EIN homologues. Numbers in brackets indicate the amino acid length. (C) Phylogenetic analysis showing zebrafish Insm1a and Insm1b (highlighted in orange) are more similar to mammalian INSM1 than to another INSM1-like protein, MLT1. We have identified a zebrafish MLT1-like gene from genomic sequences that is more similar to mammalian MLT1 than to INSM1. z, zebrafish; h, human; and m, mouse. EXPRESSION / LABELING:
|

Reverse transcriptase-PCR analysis of zebrafish insm1a and insm1b during development. Two hundred and fifty nanograms total RNA was used per reaction. Time listed above each lane indicates embryonic age post-fertilization at which the RNA was extracted. Zebrafish neurogenesis begins at tailbud stages (9 hpf) and reaches maximal levels between 24 and 72 hpf, a pattern that is precisely followed by both insm1 transcripts. Neither transcript is expressed in adult tissues, which is consistent with mammalian expression data. The final lane is a no RNA control. Note that insm1a transcripts appear to be maternally inherited as zygotic transcription does not begin until 3 hpf, while insm1b is not. |

Embryonic expression patterns of insm1a (A, A′, D, D′, F, F′, G, and H) and insm1b (B, B′, E, I, J, and K). At 10 hpf (A, A′, B, B′, C, and C′) shortly after neurogenesis has been initiated, insm1a is barely detectable in the lateral trunk while insm1b is expressed in a broader range of presumptive trunk neurons, as shown by similarities to expression of the proneural gene deltaA (C, C′, L, M, and N). (A–C) Anterior expression while A′, B′, and C′ show trunk expression of the same embryo. At 14 hpf (D, D′, and E) insm1a is visible in a disorganized manner in the rostral trunk region (inset D′), presumably pancreatic progenitors. insm1b is clearly visible in the presumptive trigeminal ganglia (E). By 24 hpf (F, F′, I, and L) it is evident that both insm1a and insm1b are expressed in a subset of proneural, deltaA-positive cells. Ventral endoderm in the rostral trunk shows a clustering of cells expressing insm1a (inset F′). At 48 hpf (G, J, and M) both insm1a and insm1b are visible throughout the CNS and expression in the spinal cord is no longer detectable. Expression is also seen as dorsoventral stripes in the hindbrain. Retinal expression of insm1a is prevalent at 48 hpf, however by 72 hpf (H, K, and N) it is restricted to a subset of cells, consistent with a transient process such as neuronal differentiation or maturation. Scale bars represent 100 μm. Inset images were taken of flat mounts of the same embryo shown in its respective panel. cb, cerebellum; cg, cranial ganglia; d, diencephalon; ep, epiphysis; hb, hindbrain; mb, midbrain; olf, olfactory placode; ot, otic vesicle; r, rhombomere; ret, retina; scn, spinal cord neurons; tec, optic tectum; teg, tegmentum; tel, telencephalon; tg, trigeminal ganglia; and tn, trunk neurons. EXPRESSION / LABELING:
|
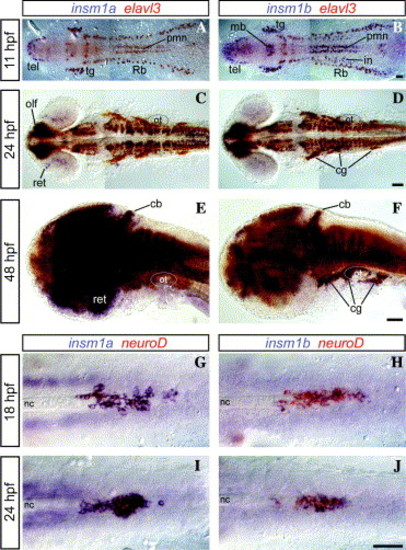
Neuronal and pancreatic expression of insm1a (A, C, E, G, and I) and insm1b (B, D, F, H, and J) in zebrafish. All panels show anterior to the left with complete (A–D), lateral (E and F), and ventral focal planes (G–J). Scale bars represent 50 μm. Fluorescein labeled elavl3 (A–F) or neuroD (G–J) antisense probe was used to indicate specified neurons or pancreatic cells (red), respectively. insm1 is shown in purple and the resulting overlap appears brown with varying intensities. At 11 hpf (A and B) elavl3 is expressed in neurons of the early CNS and insm1 overlap this expression precisely in several types of neurons. At 24 hpf (C and D) there is a large degree of overlap between insm1 and elavl3. By 48 hpf (E and F) elavl3 labels the entire CNS and darker regions indicate where insm1 is expressed, notably the cranial ganglia for insm1b and retina for insm1a. As a reference for elavl3-only (red) neurons, insm1a is not present in pmn at 11 hpf and barely detectable in the cranial ganglia at 24 hpf; otic vesicles are indicated for positional reference. Pancreatic expression of insm1a and insm1b coincide with neuroD in a disorganized manner at 18 hpf (G and H) and later come together to a continuous expression domain at 24 hpf (I and J). cb, cerebellum; cg, cranial ganglia; in, interneurons; mb, midbrain; nc, notochord; olf, olfactory placode; ot, otic vesicle; pmn, primary motoneurons; Rb, Rohon-beard neurons; ret, retina; tel, telencephalon; and tg, trigeminal ganglia. EXPRESSION / LABELING:
|
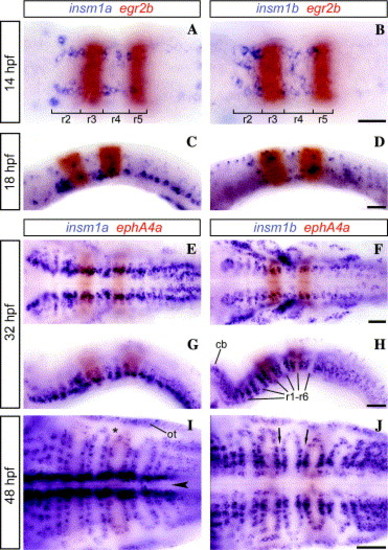
Hindbrain expression of zebrafish insm1a (A, C, E, G, and I) and insm1b (B, D, F, H, and J). Rhombomeres 3 and 5 are marked by egr2b (A–D) or ephA4a (E–J) expression (red). All panels are shown with anterior to the left in ventral (A, B, E, F, I, and J) or mediolateral (C, D, G, and H) focal planes. Scale bars represent 50 μm. At 14 hpf (A and B) insm1a and insm1b are seen in rhombomeres 2 and 4. At 18 hpf (C and D), insm1a becomes more prevalent in the ventral hindbrain while insm1b is fairly dispersed. During pharyngula stages (32 hpf; E–H) insm1a expression is dominant adjacent to the midline and insm1b in the cranial ganglia. Alternating large and small gaps representing rhombomeres and rhombomere boundaries, respectively, are seen in r1 through r6. By 48 hpf (I and J) both insm1a and insm1b occupy a dorsoventral plane that extends laterally, directly adjacent to rhombomere boundaries (arrows). However, this plane does not extend entirely to the edge of the rhombomere, instead it converges within a rhombomere to form a funnel-shape (asterisk) between posterior and anterior segments of adjacent rhombomeres. There is considerable expression of insm1a adjacent to the midline (arrowhead). For lateral views tissues surrounding the hindbrain were removed for clarity. Note that the majority of egr2b or ephA4a staining is dorsal (seen in C and D) which results in a blurred boundary in the ventral focal planes shown. cb, cerebellum; ot, otic vesicle; and r, rhombomere. EXPRESSION / LABELING:
|

Unillustrated author statements |
Reprinted from Gene expression patterns : GEP, 6(7), Lukowski, C.M., Ritzel, R.G., and Waskiewicz, A.J., Expression of two insm1-like genes in the developing zebrafish nervous system, 711-718, Copyright (2006) with permission from Elsevier. Full text @ Gene Expr. Patterns