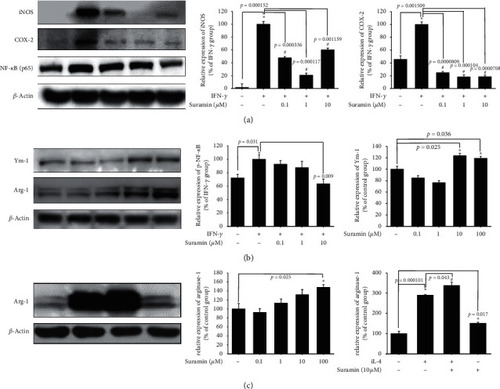
Effect of suramin on interferon-gamma- (IFN-γ-) induced upregulation of iNOS (inducible nitric oxide synthase) and COX-2 (cyclooxygenase-2) and increased Ym-1 and arginase-1 (arg-1) in BV2 murine microglial cells. (a) BV2 cells were cotreated with 0.1, 1, or 10 μM suramin and challenged with 10 U/mL of IFN-γ for 24 h; western blotting for iNOS, COX-2, and NF-κB (p65) of the control; IFN-γ; and IFN-γγ plus 0.1, 1, or 10 μM suramin group is shown. β-Actin was used as an internal control. Data are presented as mean ± SEM, and each value contains three replicates and three samples. Significantly different from the control group; #significantly different from the IFN-γ group. (b) BV2 cells were treated with 0.1, 1, 10, and 100 μM suramin for 24 h; western blotting for Ym-1 and arg-1 proteins of the control, 0.1, 1, 10, or 100 μM suramin group is shown. β-Actin was used as an internal control. Data are presented as mean ± SEM, and each value contains three replicates and three samples. Significantly different from the control group. (c) BV2 cells were cotreated with 10 μM suramin and challenged with IL-4 for 24 h; western blotting for the arg-1 protein of the control; IL-4; and IL-4 plus 0.1, 1, 10, or 100 μM suramin group is shown. β-Actin is used as an internal control. Data are presented as mean ± SEM, and each value contains three replicates and three samples. Significantly different from the control group; #significantly different from the IL-4 group.

The neuroprotective effect of suramin on 6-OHDA-induced damage in SH-SY5Y cells. (a) SH-SY5Y cells were pretreated with 0.01, 0.1, 1, and 10 μM suramin for 1 h and then challenged with 20 μM 6-OHDA for 16 h in the control, 6-OHDA, 6-OHDA plus suramin, and suramin alone groups. The 6-OHDA-treated group was normalized as 0%. Data are presented as mean ± SEM, and each value contains three replicates and six samples. Significantly different from the 6-OHDA group. (b) SH-SY5Y cells were pretreated with 10 μM suramin and then challenged with 20 μM 6-OHDA for 8 h in the control, 6-OHDA, 6-OHDA plus suramin, and suramin alone groups. TUNEL staining was performed, and white arrows represent apoptotic cells (scale bar, 100 μM). The quantification of apoptotic cells is shown. (c) Western blotting of cleaved caspase-3 protein and quantification of each group. Data are presented as mean ± SEM, and each value contains three replicates and six samples. Significantly different from the control group; #significantly different from the 6-OHDA group.

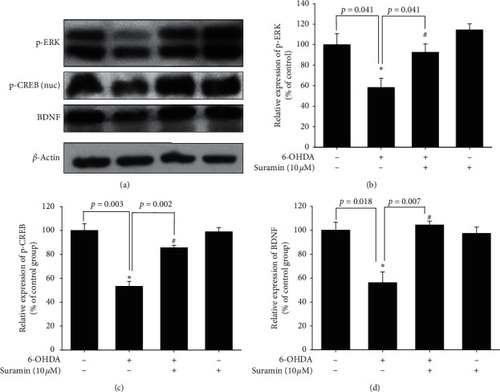
Effect of suramin on 6-OHDA-induced downregulation of phospho-extracellular signal-regulated kinases (p-ERK), phospho-cAMP response element-binding protein (CREB), and brain-derived neurotrophic factor (BDNF) in SH-SY5Y cells. (a) SH-SY5Y cells were pretreated with 10 μM suramin for 1 h and then challenged with 20 μM 6-OHDA for 1 h; western blotting for p-ERK and p-CREB of the control, 6-OHDA, 6-OHDA plus suramin, and suramin alone groups is shown. SH-SY5Y cells were pretreated with 10 μM suramin for 1 h and then challenged with 20 μM 6-OHDA for 8 h; western blotting for BDNF of the control, 6-OHDA, 6-OHDA plus suramin, and suramin alone groups is shown. β-Actin was used as an internal control. (b) The quantification results of p-ERK relative density are shown. (c) The quantification results of p-CREB relative density are shown. (d) The quantification results of p-ERK relative density are shown. Data are presented as mean ± SEM, and each value contains three replicates and three samples. Significantly different from the control group; #significantly different from the 6-OHDA group.

Effect of PTP1B knockdown in SH-SY5Y on PTP1B expression and neuroprotective effect against 6-OHDA damage. (a) SH-SY5Y cells were transfected with siRNAs by LipofectAMINE PlusReagent for 3 h and incubated with new medium overnight. Western blotting for PTP1B of the control (negative control), 6-OHDA (negative control), control (positive control), 6-OHDA (positive control), control (PTP1B siRNA), and 6-OHDA (PTP1B siRNA) groups is shown. Data are presented as mean ± SEM, and each value contains three replicates and three samples. Significantly different from the control (negative control) group. (b) SH-SY5Y cells were transfected with siRNAs by LipofectAMINE PlusReagent for 3 h and incubated with new medium overnight. Cell viability of the control (negative control), 6-OHDA (negative control), control (positive control), 6-OHDA (positive control), control (PTP1B siRNA), and 6-OHDA (PTP1B siRNA) groups is measured. Data are presented as mean ± SEM, and each value contains three replicates and three samples. Significantly different from the control (negative control) group. #Significantly different from the 6-OHDA (negative control) group.

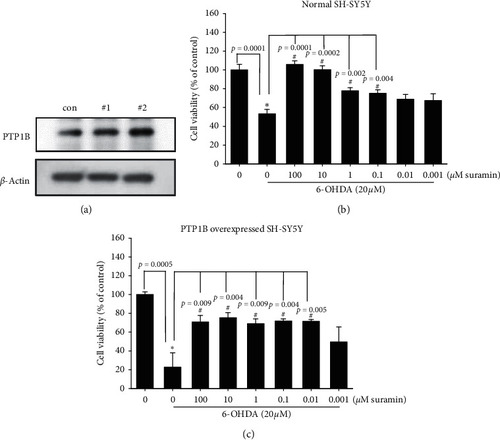
Effect of PTP1B overexpression in SH-SY5Y on PTP1B expression and neuroprotective effect against 6-OHDA damage. (a) PTP1B-overexpressed SH-SY5Y was established by the transfection of PTP1B plasmid. Western blotting for PTP1B of the control, #1 PTP1B-overexpressed SH-SY5Y, and #2 PTP1B-overexpressed SH-SY5Y groups are shown. (b) Normal SH-SY5Y cells were pretreated with 0.01, 0.1, 1, and 10 μM suramin for 1 h and then challenged with 20 μM 6-OHDA for 16 h in the control, 6-OHDA, 6-OHDA plus suramin, and suramin alone groups. Data are presented as mean ± SEM, and each value contains three replicates and six samples. Significantly different from the 6-OHDA group. (c) PTP1B-overexpressed SH-SY5Y was established by the transfection of PTP1B plasmid. Cell viability of the control; 6-OHDA; and 6-OHDA plus 100, 10, 1, and 0.1 μM suramin groups was measured. Data are presented as mean ± SEM, and each value contains three replicates and three samples. Significantly different from the control (negative control) group. #Significantly different from the 6-OHDA (negative control) group.

Neuroprotective effect of suramin on the 6-OHDA-induced zebrafish PD model. (a) Zebrafish were pretreated with 10 μM suramin from 9 h after fertilization (hpf) to 3 days after fertilization (dpf) and then challenged with 250 µM 6-OHDA from 2 to 3 dpf. Quantitative PCR of PTP1B for the control and 6-OHDA groups was performed. (b) Zebrafish were pretreated with 10 μM suramin from 9 hpf to 3 dpf and then challenged with 250 µM 6-OHDA from 2 to 3 dpf. Quantitative PCR of BDNF for the control, 6-OHDA, 6-OHDA plus suramin, and suramin alone groups was performed. (c) Zebrafish were pretreated with 10 μM suramin from 9 hpf to 3 dpf and then challenged with 250 µM 6-OHDA from 2 to 3 dpf. Quantitative PCR of iNOS for the control, 6-OHDA, 6-OHDA plus suramin, and suramin alone groups was performed. (d) Zebrafish were pretreated with 10 μM suramin from 9 hpf to 5 dpf and then challenged with 250 µM 6-OHDA from 2 to 5 dpf. Western blotting of p-eIF2 and GRP-78 for the control, 6-OHDA, 6-OHDA plus suramin, and suramin alone groups was performed. (e) Quantitative results of p-eIF2 protein expression. (f) Quantitative result of GRP-78 protein expression. Data are presented as mean ± SEM, and each value contains three replicates and three samples. Significantly different from the control; #significantly different from the 6-OHDA group.

Effect of suramin on 6-OHDA-induced locomotor deficit and tyrosine hydroxylase (TH) expression in the zebrafish PD model. (a) Zebrafish were pretreated with 0.1, 1, and 10 μM suramin from 9 hpf to 5 dpf and then challenged with 250 µM 6-OHDA from 2 to 5 dpf. The upper panel demonstrates a representative swimming pattern, and the lower panel shows the average total swimming distance. (b) Zebrafish were pretreated with 10 μM suramin from 9 hpf to 5 dpf and then challenged with 250 µM 6-OHDA from 2 to 5 dpf. Western blotting of TH for the control, 6-OHDA, 6-OHDA plus suramin, and suramin alone groups was performed. Data are presented as mean ± SEM, and each value represents the mean of 16 samples. Significantly compared with the control group; #compared with the 6-OHDA group.

Schematic diagram of PTP1B in IFN-γ-induced neuroinflammation and 6-OHDA-induced neuronal death. IFN-γ could increase PTP1B expression and further modulate downstream cascade, including the upregulation of proinflammatory cytokines, such as iNOS, COX-2, and NF-κB. Treatment of 6-OHDA could also affect PTP1B and its downstream neuroprotection-related pathway, including the downregulation of p-CREB, GRP-78, and BDNF and upregulation of p-eIF2. Our study revealed that the PTP1B inhibition by suramin could reverse IFN-γ-induced upregulation of iNOS and COX-2 protein expression. Moreover, suramin could modulate M2 type microglia-related protein and increase arginase-1 and Ym-1 protein expression. PTP1B inhibition also reversed the 6-OHDA-induced downregulation of p-CREB and BDNF protein expression. In the anti-ER stress section, suramin further enhanced 6-OHDA-induced upregulation of p-eIF2 expression and reversed 6-OHDA-induced downregulation of GRP-78 expression. The effect of suramin significantly protected dopamine neurons against damage.

Acknowledgments
This image is the copyrighted work of the attributed author or publisher, and ZFIN has permission only to display this image to its users. Additional permissions should be obtained from the applicable author or publisher of the image. Full text @ Parkinsons Dis