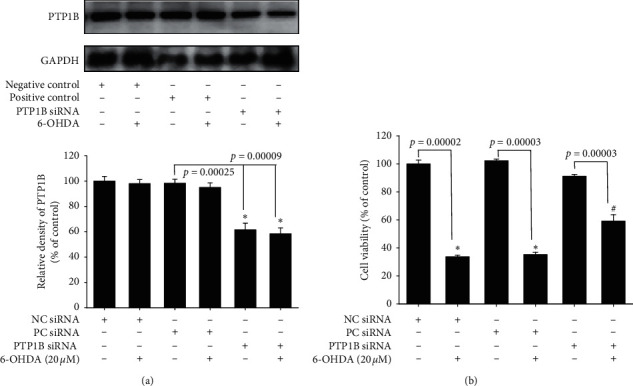
IMAGE

Figure 4

ID
ZDB-IMAGE-210121-29
Source
Figures for Feng et al., 2020
Image
Figure Caption

Figure 4

Effect of PTP1B knockdown in SH-SY5Y on PTP1B expression and neuroprotective effect against 6-OHDA damage. (a) SH-SY5Y cells were transfected with siRNAs by LipofectAMINE PlusReagent for 3 h and incubated with new medium overnight. Western blotting for PTP1B of the control (negative control), 6-OHDA (negative control), control (positive control), 6-OHDA (positive control), control (PTP1B siRNA), and 6-OHDA (PTP1B siRNA) groups is shown. Data are presented as mean ± SEM, and each value contains three replicates and three samples. Significantly different from the control (negative control) group. (b) SH-SY5Y cells were transfected with siRNAs by LipofectAMINE PlusReagent for 3 h and incubated with new medium overnight. Cell viability of the control (negative control), 6-OHDA (negative control), control (positive control), 6-OHDA (positive control), control (PTP1B siRNA), and 6-OHDA (PTP1B siRNA) groups is measured. Data are presented as mean ± SEM, and each value contains three replicates and three samples. Significantly different from the control (negative control) group. #Significantly different from the 6-OHDA (negative control) group.

Acknowledgments
This image is the copyrighted work of the attributed author or publisher, and ZFIN has permission only to display this image to its users. Additional permissions should be obtained from the applicable author or publisher of the image. Full text @ Parkinsons Dis