IMAGE

Figure 2

ID
ZDB-IMAGE-210121-27
Source
Figures for Feng et al., 2020
Image
Figure Caption

Figure 2

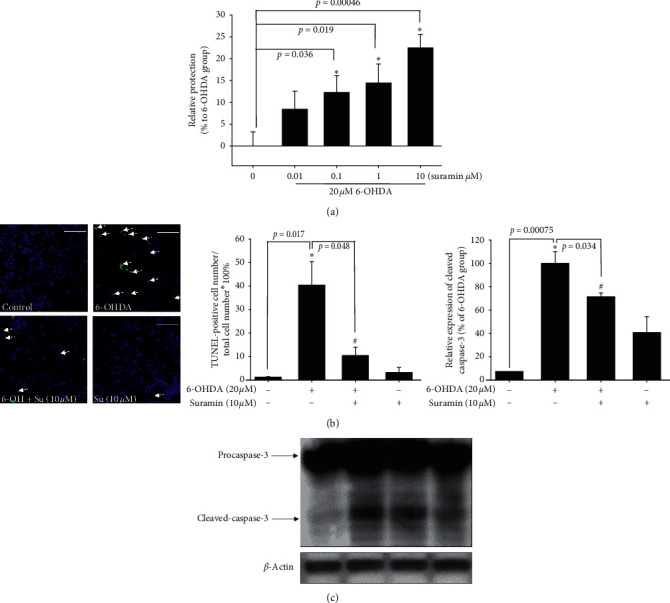
The neuroprotective effect of suramin on 6-OHDA-induced damage in SH-SY5Y cells. (a) SH-SY5Y cells were pretreated with 0.01, 0.1, 1, and 10 μM suramin for 1 h and then challenged with 20 μM 6-OHDA for 16 h in the control, 6-OHDA, 6-OHDA plus suramin, and suramin alone groups. The 6-OHDA-treated group was normalized as 0%. Data are presented as mean ± SEM, and each value contains three replicates and six samples. Significantly different from the 6-OHDA group. (b) SH-SY5Y cells were pretreated with 10 μM suramin and then challenged with 20 μM 6-OHDA for 8 h in the control, 6-OHDA, 6-OHDA plus suramin, and suramin alone groups. TUNEL staining was performed, and white arrows represent apoptotic cells (scale bar, 100 μM). The quantification of apoptotic cells is shown. (c) Western blotting of cleaved caspase-3 protein and quantification of each group. Data are presented as mean ± SEM, and each value contains three replicates and six samples. Significantly different from the control group; #significantly different from the 6-OHDA group.

Acknowledgments
This image is the copyrighted work of the attributed author or publisher, and ZFIN has permission only to display this image to its users. Additional permissions should be obtained from the applicable author or publisher of the image. Full text @ Parkinsons Dis