FIGURE SUMMARY
Title

miR-128a Acts as a Regulator in Cardiac Development by Modulating Differentiation of Cardiac Progenitor Cell Populations

Authors
Hoelscher, S.C., Stich, T., Diehm, A., Lahm, H., Dreßen, M., Zhang, Z., Neb, I., Aherrahrou, Z., Erdmann, J., Schunkert, H., Santamaria, G., Cuda, G., Gilsbach, R., Hein, L., Lange, R., Hassel, D., Krane, M., Doppler, S.A.
Source
Full text @ Int. J. Mol. Sci.

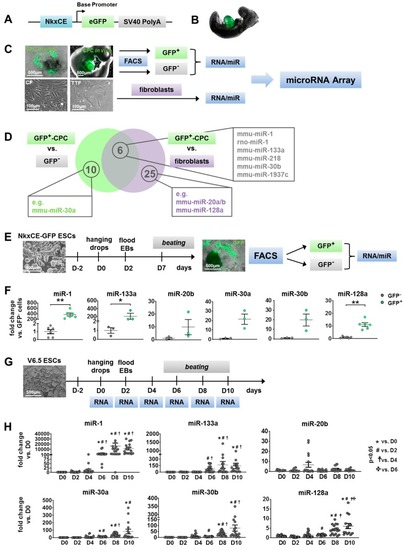
Identification of candidate microRNAs (miRs) during cardiac development. (A) Nkx2.5 cardiac enhancer eGFP (NkxCE-GFP) vector construct: (B) The cardiac specific NkxCE (~9.5kb upstream of Nkx2.5-ATG site) exclusively marks cardiac progenitor cells (CPCs) in embryonic hearts by GFP expression, as shown in an E9.5 mouse embryo. (C) Generation of cells for microRNA (miR) Array: GFP-positive cardiac progenitor cells (CPCs) and correspondent GFP negative cell fractions were sorted by flow cytometry (FACS) from E9.5 mouse embryos and in vitro differentiations on day 7 (D7) (upper images, scale bars: 500 µm). RNA/miR was isolated from murine tail tip fibroblasts (TTFs) and cardiac fibroblasts (CFs) (lower images, scale bars: 100 µm) for comparative analysis of miR expression profiles. (D) Venn diagram of upregulated miR candidates from miR Array analysis. 16 miRs were up-regulated (>1.5-fold, p < 0.05) in GFP-positive CPCs compared to their GFP-negative counterparts and 31 miRs were up-regulated in comparison to fibroblast populations (TTFs, CFs). Six of these miRs (e.g., miR-1, -133a, -30b, miR-218) were enriched in GFP-positive CPCs versus both GFP-negative cells and fibroblasts. (E) Experimental setup of in vitro differentiation (hanging drop method) of NkxCE-GFP ESCs for verification of miR candidates (scale bars: 500 µm). At differentiation day 7 (D7), GFP-positive CPCs and GFP-negative cell fractions were sorted by FACS, and total RNA was purified. (F) CPC marker miRs miR-1 (n = 6, Mann–Whitney test, p = 0.0022) and miR-133a (n = 3, t-test, p = 0.0465) were significantly upregulated at D7 in NkxCE-GFP CPCs in comparison to stage-matched negative cells, whereas only miR-128a (n = 6, Mann–Whitney-test, p = 0.0022) was significantly enriched of candidate miRs in NkxCE GFP-positive CPCs. No significance was found for miR-20b, -30a, and -30b (n = 3 each, t-test). Three assays were performed, whereas only for miR-1 and miR-128, samples were measured in duplicates. (G) To evaluate miR kinetics during in vitro differentiation, non-transgenic murine ESCs (V6.5, scale bar: 500 µm) were differentiated (hanging drop method) until day 10. RNA was isolated every other day for qRT-PCR. (H) Expression of miR-1 and -133a followed a typical course by rising at the beginning of cardiomyogenesis around D4 to D6. MiR-30a, -30b, and -128a also rose around D4 to D8. However, expression of miR-20b appears to be biphasic with a peak on D4 and D8. Three assays were performed in triplicate (n = 9 per timepoint; each sample was measured in duplicates n = 18 per timepoint; ANOVA followed by Dunn’s Method). All data are represented as means ±SEM. * p ≤ 0.05, ** p ≤ 0.01.

Evaluation of candidate miR function during zebrafish development. (A) MiR kinetics were evaluated during early zebrafish development. Total RNA was isolated on respective timepoints (hours post fertilization; hpf) for qRT-PCR. (B) MiR-20b, -30a, -30b, and -128a were upregulated in developing zebrafish larvae from 24 hpf increasing until 72 hpf. (C) Morpholino oligos (MOs) were injected in 1–2 cell-stage zebrafish embryos and miR knockdown, morphological changes, fractional shortening, and beating rate was analyzed (24, 48, 72 hpf). (D) MiR expression (evaluated by qRT-PCR) in zebrafish larvae was sufficiently reduced by MOs at 24 hpf by more than 85% for all candidate miRs in comparison to controls without MOs (t-test). (E) Morphological changes of MO-morphants at 48 hpf. MO-20b morphants showed cerebral hemorrhage (red arrow) and edema (edema in the eye region indicated by a white arrow). MO-30b morphants developed malformations and edemas (red arrow highlights a visible edema and enlarged hydrocephalus). MO-128a larvae exhibited a robust pericardial edema (red arrow) and blood congestion at the right outflow tract of the heart (white arrow). Scale bars: 250 µm. (F) Cardiac phenotype of MO-128a treated Tg(myl7:ras-GFP) zebrafish larvae at 48 hpf including smaller ventricles (white arrow) and abnormalities in heart looping. Scale bars: 5 µm. (G) MO-128a larvae (n = 8) showed a significantly reduced fractional shortening at 72 hpf compared to non-treated larvae (w/o MO, n = 10) (t-test) (H) MO-128a morphants (n = 11) appeared to have a significantly slower heart rate at 72 hpf compared to the controls (w/o MO, n = 11) (t-test). All data are represented as means ± SEM. * p ≤ 0.05, ** p ≤ 0.01 and *** p ≤ 0.001.

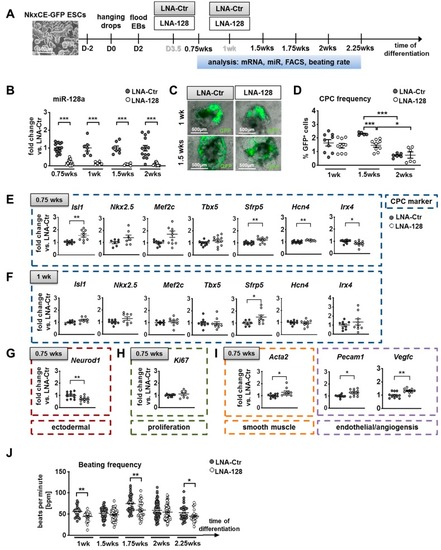
Knockdown of miR-128a during in vitro differentiation of murine NkxCE-GFP embryonic stem cells (ESCs). (A) NkxCE-GFP ESCs (scale bar: 500 µm) were differentiated using the hanging drop method. Transfections of locked nucleic acid (LNA) probes for knockdown of miR-128a (LNA-128) and corresponding non-targeting controls (LNA-Ctr) were performed on day 3.5 (D3.5) and after one week (wk) of differentiation. Analysis was performed on respective timepoints between 0.75 and 2.25 wks. Abbreviations: EB: Embryoid bodies; FACS: Flow cytometry; (B) MiR-128a was significantly downregulated (p < 0.001, Mann–Whitney test) by LNA-128 from 0.75 wks until 2 wks when compared to respective LNA-Ctrs. At least 3 assays in triplicates were performed per time-point. (C) NkxCE-GFP-positive CPCs after 1 wk (upper panel, scale bars: 500 µm) and 1.5 wks (lower panel, scale bars: 500 µm) after transfection with either LNA-Ctr or LNA-128. The images are an overlay between phase contrast and fluorescent pictures. (D) The frequency of NkxCE-GFP-positive CPCs with miR-128 knockdown (n = 9) was slightly reduced after 1 wk, becoming significantly downregulated after 1.5 wks (n = 5, 9; p = 0.001, Mann–Whitney test). The CPC frequency after 2 wks was not affected by LNA-128 compared to LNA-Ctr (n = 6). 3 assays in triplicates for 1 wks and 1.5 wks, 2 assays in triplicates for 2 wks. (EI). Gene expression panels during NkxCE-GFP ESC differentiation after miR-128 knockdown. The panels show the expression of early CPC markers after 0.75 wks (n = 11, 4 assays in triplicates, t-test or Mann–Whitney test) (E) and 1 wk (n = 9, 3 assays in triplicates, t-test or Mann–Whitney test) (F) as well as neuroectodermal (t-test) (G), proliferation (H), smooth muscle (Mann–Whitney test), endothelial, and angiogenesis markers (t-test) (I) after 0.75 wks. (J) Beating frequency (beats per minute, bpm) of early cardiomyocytes was downregulated from 1 wk to 2.25 wks on mir-128a knockdown compared to LNA-Ctr (n > 23, t-tests) (at least 4 assays, for 2.25 wks 2 assays, 8 videos were evaluated per condition from 3 independent observers). Data are represented as means ± SEM. * p ≤ 0.05, ** p ≤ 0.01 and *** p ≤ 0.001.

Knockdown of miR-128a during in vitro differentiation of murine Isl1-Cre/ROSA26mTmG induced pluripotent stem cells (iPSCs) (iITG-iPSCs). (A) iITG-iPSCs (scale bar: 500 µm) were differentiated using the hanging drop method. Transfections of LNA probes for knockdown of miR-128a (LNA-128) and corresponding controls (LNA-Ctr) were performed after 0.75 weeks (wks) and after 2 wks of differentiation. Analysis was performed on respective timepoints between 1 and 3 wks. Abbreviations: EB: Embryoid bodies; FACS: Flow cytometry; (B) MiR-128a was significantly downregulated by LNA-128 from 1 wk until 3 wks compared to respective LNA-Ctr (n = 8,7, Mann–Whitney tests, 3 assays in triplicates). (C) Isl1-GFP-positive CPCs after 2 wks (upper panel, scale bars: 500 µm) and after 3 wks (lower panel, scale bars: 500 µm) of in vitro differentiation after transfection with either LNA-Ctr or LNA-128. Images are an overlay between phase contrast and fluorescent microscopic pictures. (D) The frequency of Isl1-GFP-positive CPCs after miR-128a knockdown was significantly increased to the double amount compared to LNA-Ctr (n = 9, p = 0.024, t-test; 3 assays in triplicates) after 2 wks. At later timepoints, the Isl1-CPC frequency was not significantly affected by miR-128 knockdown (3 assays in triplicates at 2.25 wks, 2 assays in triplicates at 3 wks). (E) Isl1 expression was tendentially upregulated during iITG-iPSC differentiation after miR-128 knockdown (n = 6, 2 assays in triplicates). (F) Beating frequency (beats per minute, bpm) of differentiated iITG-iPSC EBs was reduced after miR-128 knockdown (2 and 2.25 wks: 3 assays in triplicates, 2.75 (t-test) and 3 wks (Mann–Whitney test): Two assays in triplicates, 4–9 videos per condition, 3 independent observers). Data are represented as means ± SEM. * p ≤ 0.05, ** p ≤ 0.01 and *** p ≤ 0.001.

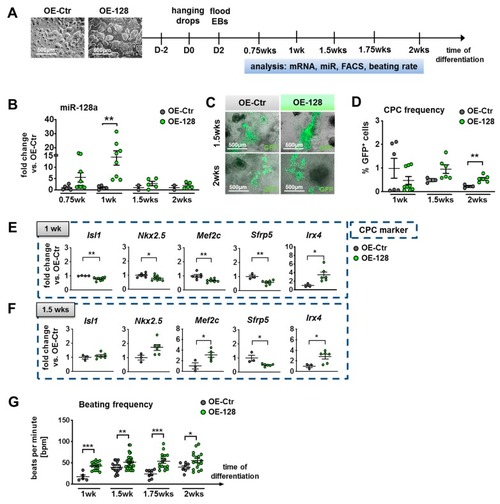
Overexpression (OE) of miR-128a during in vitro differentiation of murine NkxCE-GFP OE-128 and OE-Ctr ESCs. (A) OE-128 and OE-Ctr ESCs (scale bars: 500 µm) were differentiated for 2 weeks (wks) by the hanging drop method (without doxycycline). Analysis was performed on respective timepoints between 0.75 and 2 wks of differentiation. Abbreviations: EB: Embryoid bodies; FACS: Flow cytometry; (B) MiR-128a was overexpressed in OE-128 EBs compared to OE-Ctr EBs from early onset of cardiogenesis (0.75 wks), becoming significant after 1 wk (p < 0.01, Mann–Whitney test); 0.75 and 1 wk: 3 assays in triplicates, different clones; 1.5 and 2 wks: 2 assays in triplicates, different clones. (C) NkxCE-GFP-positive CPCs in OE-Ctr EBs or OE-128 EBs after 1.5 wks (upper panel, scale bars: 500 µm) and after 2 wks (lower panel, scale bars: 500 µm). Images are an overlay between phase contrast and fluorescent microscopic pictures. (D) NkxCE GFP-positive CPC frequency after miR-128 OE appeared to be reduced after 1 wk, whereas the frequency of NkxCE-GFP-positive CPCs slightly increased after 1.5 wks upon miR-128 OE becoming significant after 2 wks (p = 0.0088, t-test). 1 wk: 3 assays in triplicates (different clones), 1.5 and 2 wks: 2 assays in triplicates (different clones). (E,F) Gene expression panels during NkxCE-GFP ESC OE-128 and OE-Ctr differentiation. The panels show the expression of early CPC markers after 1 wk (3 assays in triplicates, different clones) (t-tests) (E) and 1.5 wks (2 assays in triplicates, different clones) (t-tests). (F,G) The beating frequency (beats per minute, bpm) of early cardiomyocytes was significantly upregulated from 1 wk to 2 wks on mir-128a OE compared to OE-Ctr EBs (2 assays in triplicates, different clones, 5–9 videos per timepoint) (t-tests or Mann–Whitney test). Data are represented as means ± SEM. * p ≤ 0.05, ** p ≤ 0.01 and *** p ≤ 0.001.

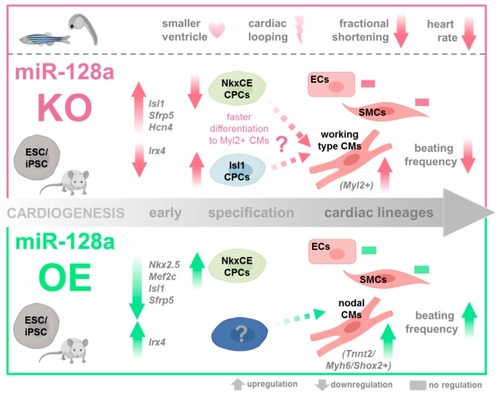
Role of miR-128a in cardiac development. During murine in vitro differentiation, LNA-mediated miR-128a knockdown in differentiating ES/iPSCs (1) increased cardiac transcription factors such as Isl1, Sfrp5, and Hcn4 but reduced Irx4 at the onset of cardiogenesis; (2) upregulated Isl1-positive CPCs, whereas NkxCE-GFP-positive CPCs were downregulated; and (3) increased the expression of the ventricular cardiomyocyte marker Myl2 accompanied by a reduced beating frequency of early cardiomyocytes. Overexpression of miR-128a (4) diminished the expression of Isl1, Sfrp5, Nkx2.5, and Mef2c, but increased Irx4, (5) enhanced the NkxCE-GFP-positive CPC population, and (6) favored nodal-type-like cardiomyocytes marked by Tnnt2, Myh6, and Shox2 accompanied by increased beating rates. Parts of the figure from BioRender.com

Acknowledgments
This image is the copyrighted work of the attributed author or publisher, and ZFIN has permission only to display this image to its users. Additional permissions should be obtained from the applicable author or publisher of the image. Full text @ Int. J. Mol. Sci.